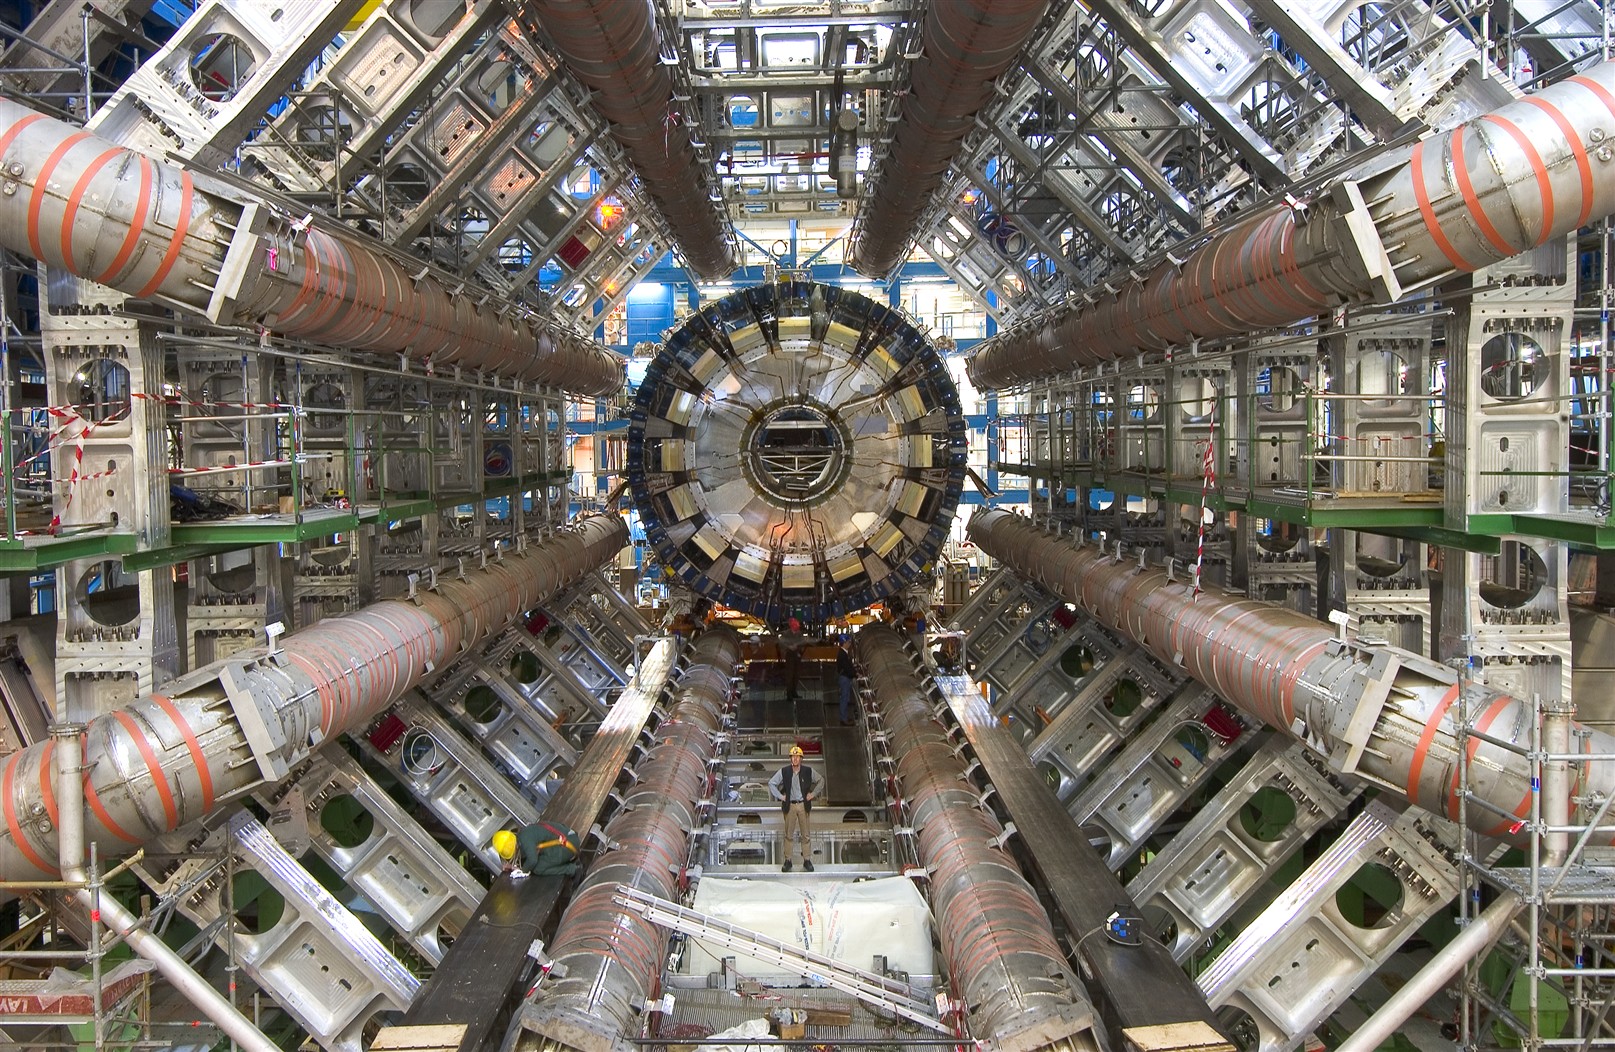
The era of brain observatories
Opportunities and challenges for data-driven neuroscience
May 16th, 2019
Halıcıoğlu Data Science Institute
UC San Diego
Ariel Rokem, University of Washington eScience Institute
Follow along at:

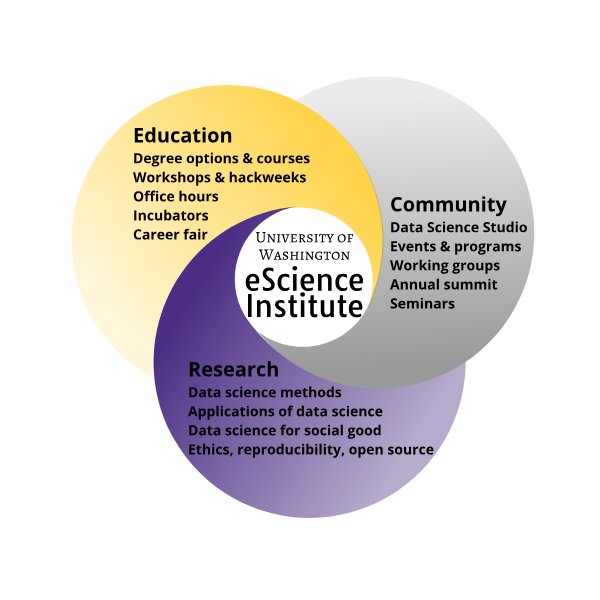
Data science education
Development of tools and practices for reproducible research
Building a data science community: open, rigorous and ethical
Data-driven research
Data-driven discovery
 By Donald Pelletier
[
By Donald Pelletier
[ By
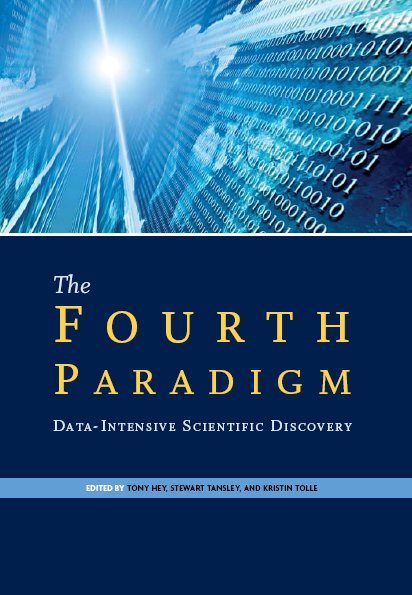
By The paradigms of scientific discovery
1. Empirical (experimental)
2. Theoretical (mathematical)
3. Simulation (computational)
4. Data-driven scientific discovery
Jim Gray
Data-driven discovery is affecting all fields!
Normal behavior is supported by brain networks
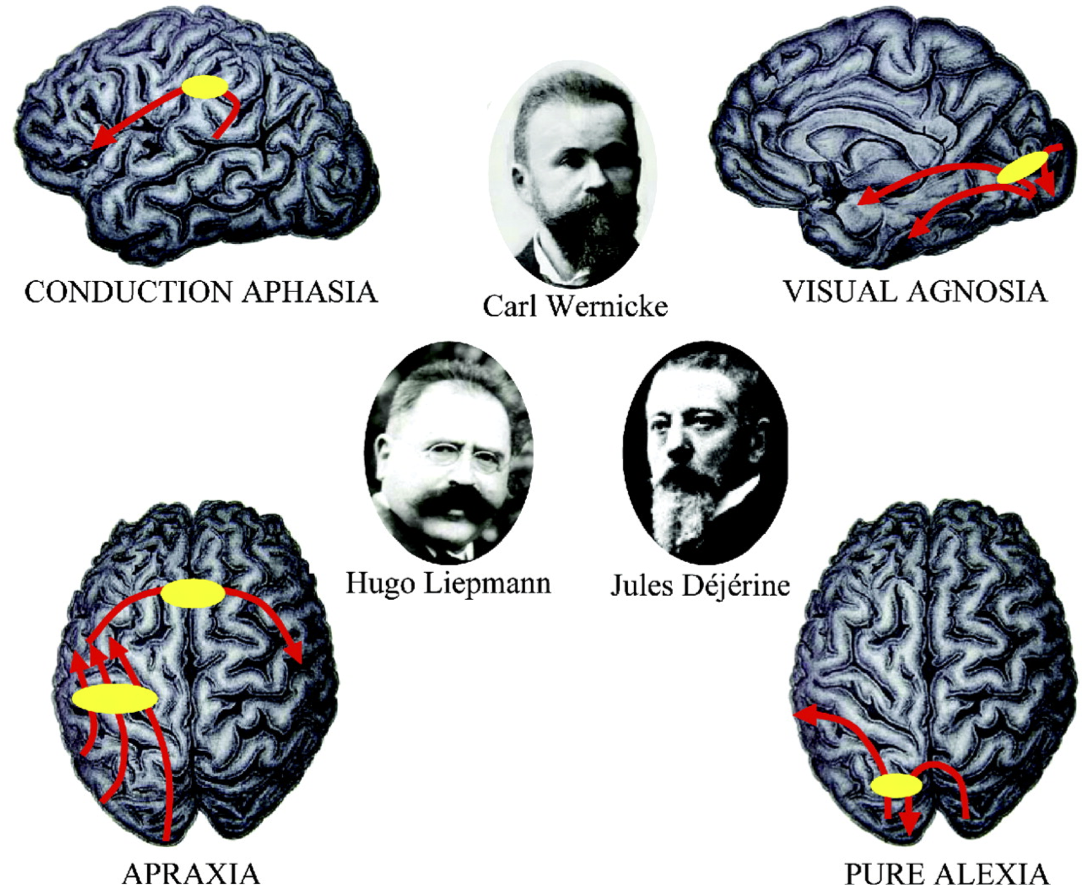
Studying brain networks
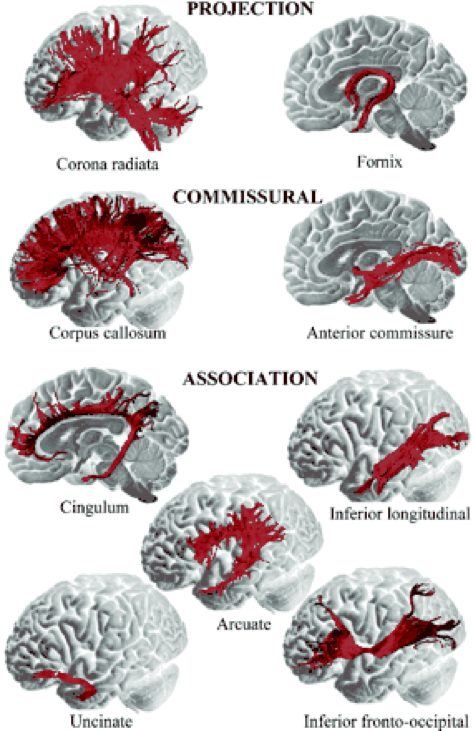
Not just static cables!
Brain connections develop and mature with age
Individual differences account for differences in behaviour
Adapt and change with learning
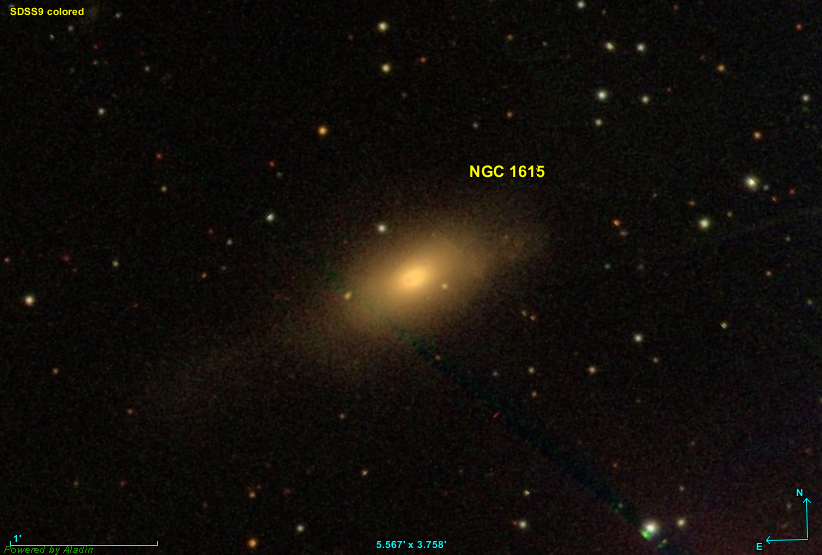
The era of brain observatories
Human Connectome Project (HCP), N = 1,200
Pediatric Imaging Neurocognition and Genetics (PING),
N >1,000
Healthy Brain Network (HBN), N = 10,000
Adolescent Brain Cognitive Development (ABCD),
N = 10,000
UK Biobank, N = 500,000
Opportunities
New data sets will enable important new discoveries
Data-driven discovery
Challenges
Scale
How do we adapt research to big datasets?
Use deep learning and citizen science
Complexity
How do we analyze and interpret multi-dimensional data?
Leverage machine learning techniques that use known brain structure
Socio-technical
How do we collaborate, publish and teach?
Open science: sharing data, software and training
Challenge: scaling to Big Data
Some methods require expert examination
Time consuming, tedious
→ Do not scale well!
The solution
Expert → results
Expert → training data → machine learning → results
Learning from experts

Aaron Lee
(UW Ophthalmology)

Sa Xiao
(UW Ophthalmology → Google)
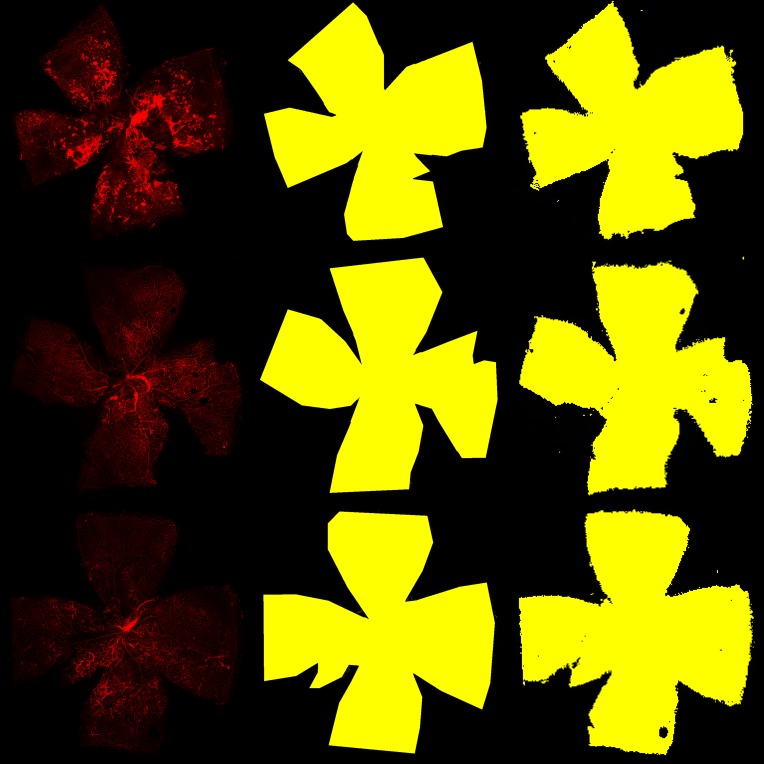
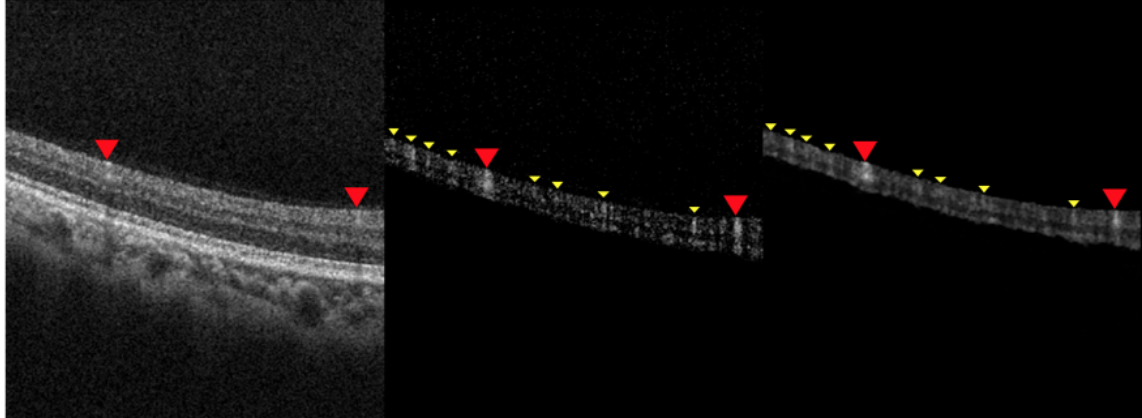
Oxygen induced retinopathy
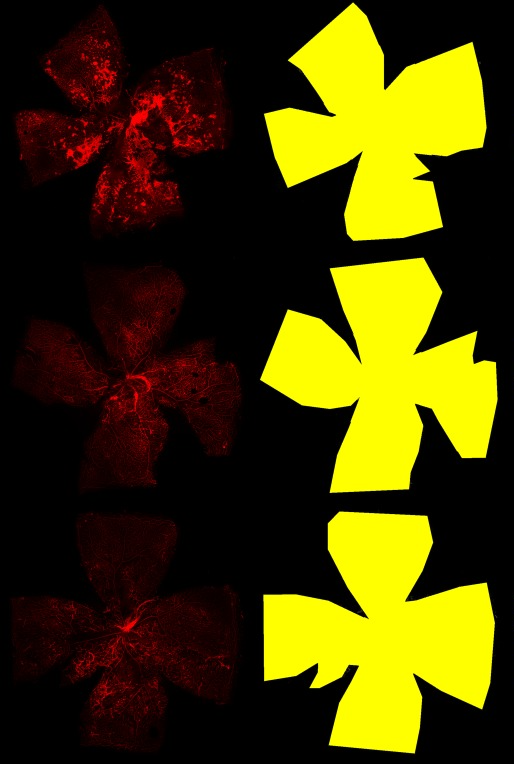
Retinal segmentation
Oxygen induced retinopathy
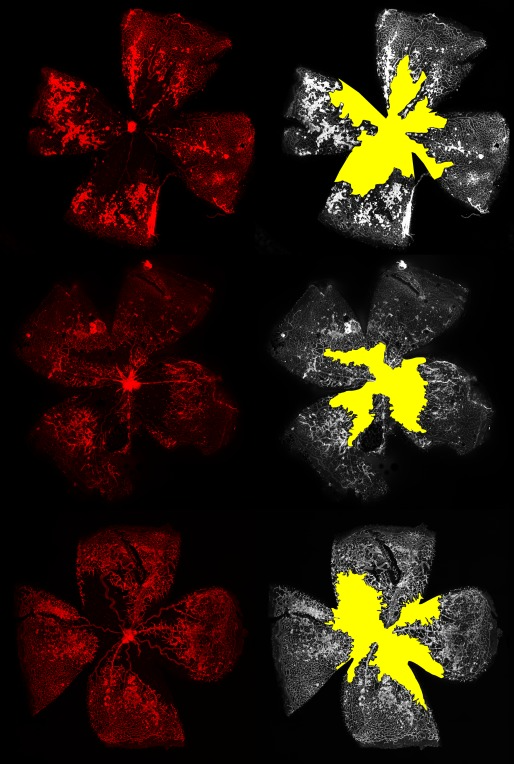
The vaso-obliteration zone
oxygen induced retinopathy
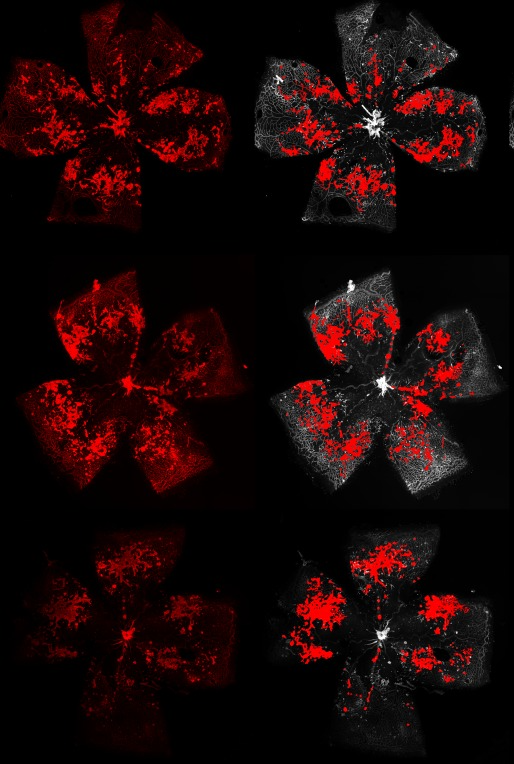
The neovascular tufts
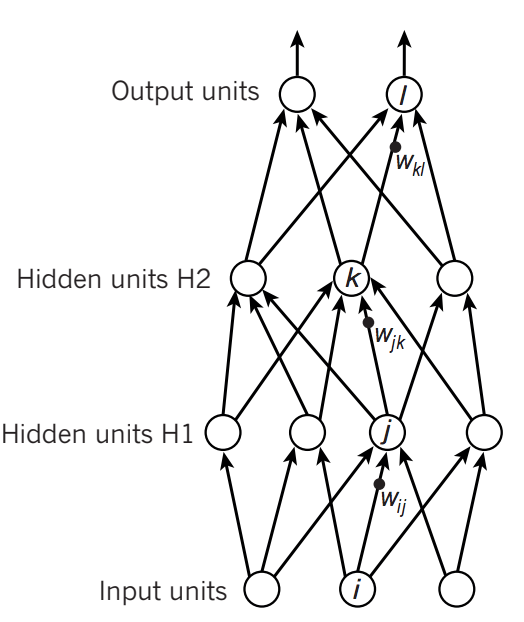
Artificial neural networks
A family of machine learning algorithms
Biologically inspired
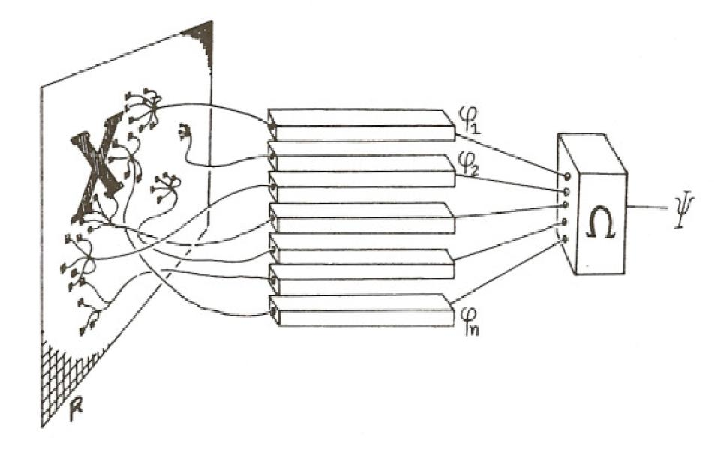
Minsky and Papert (1969)
A cascade of linear/non-linear operations
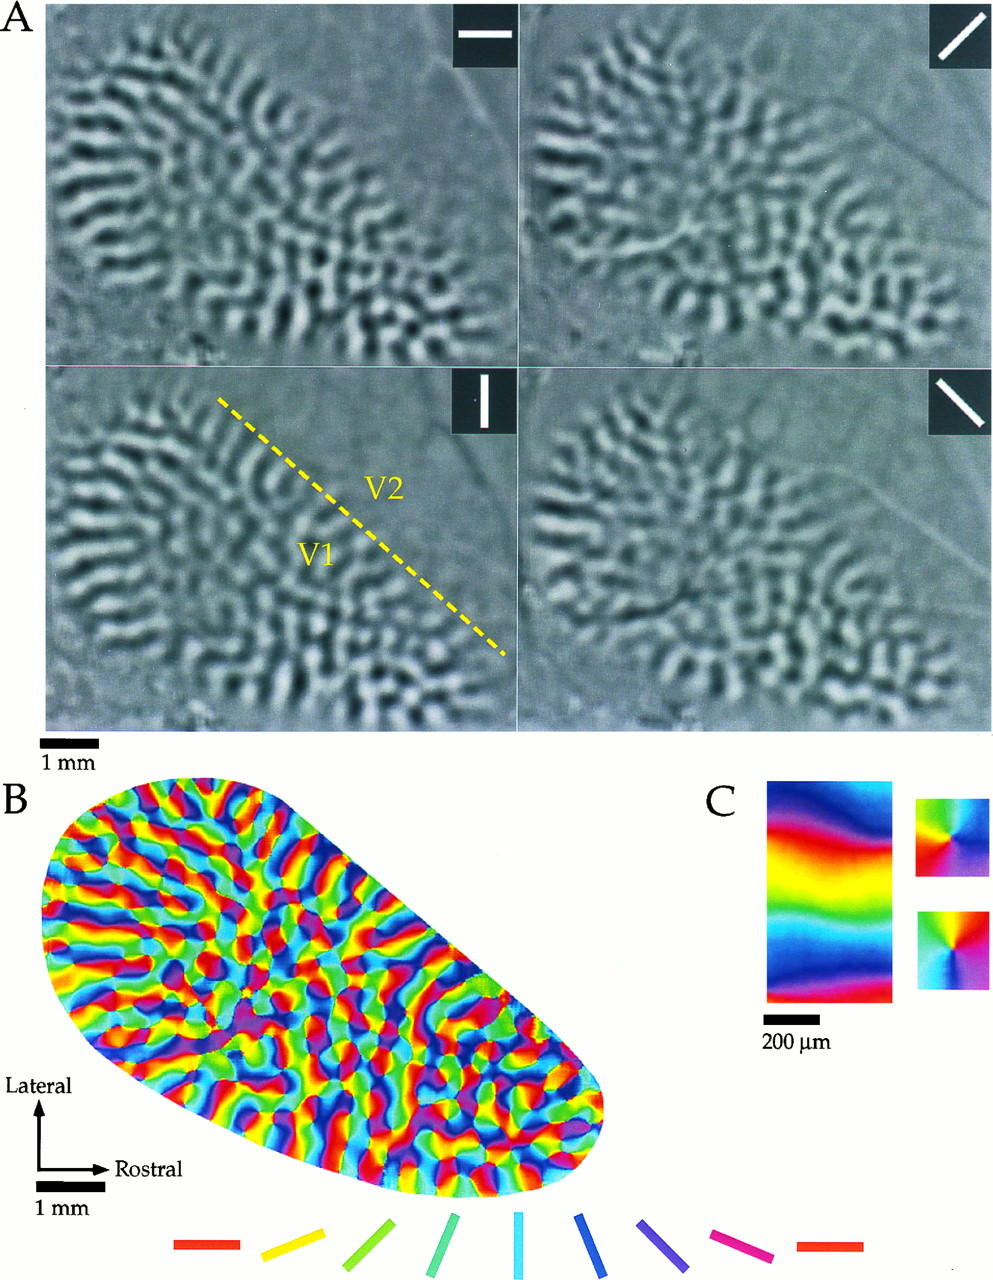
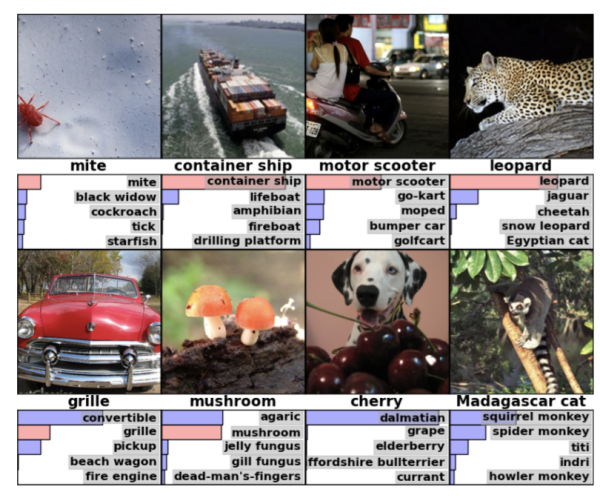
Convolutional networks
Inspired by the visual system
Capitalize on spatial correlations in images
Fully convolutional networks
Take an image as input and produce an image as output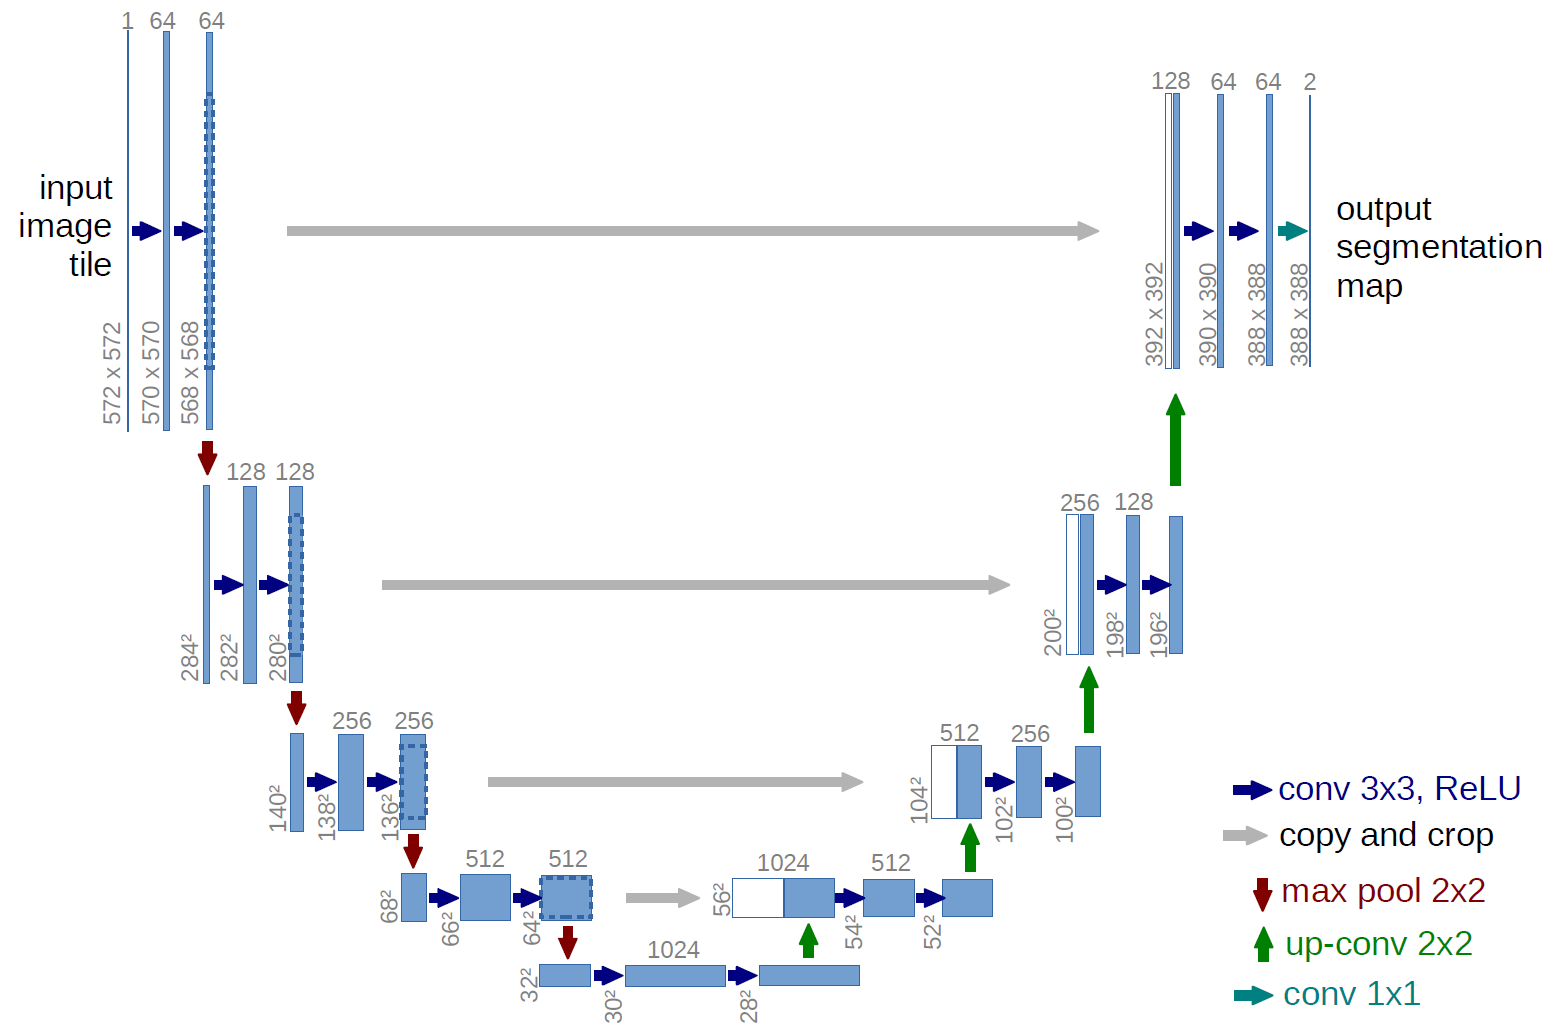
oxygen induced retinopathy
Retinal segmentation
Oxygen induced retinopathy
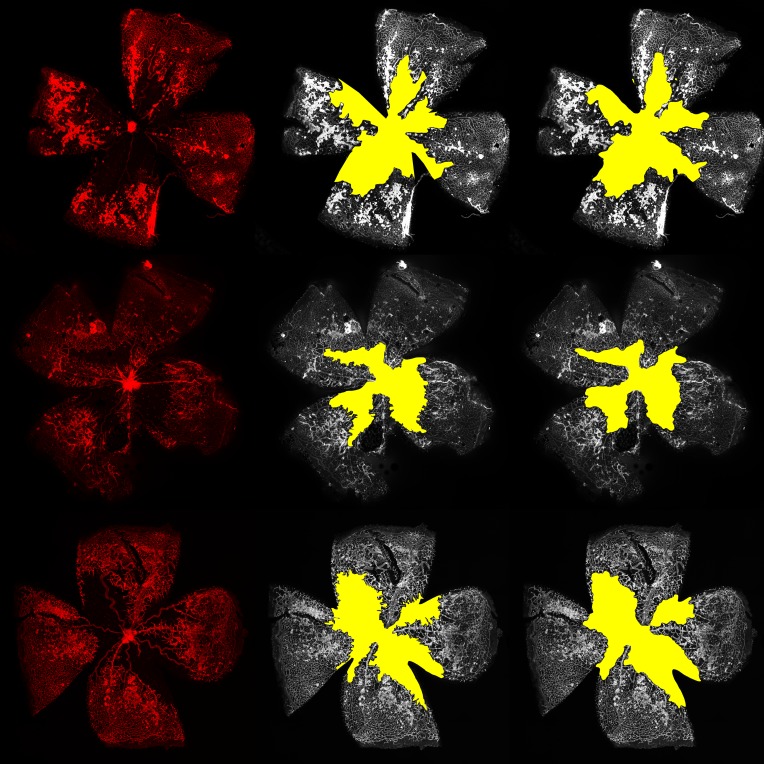
The vaso-obliteration zone
oxygen induced retinopathy
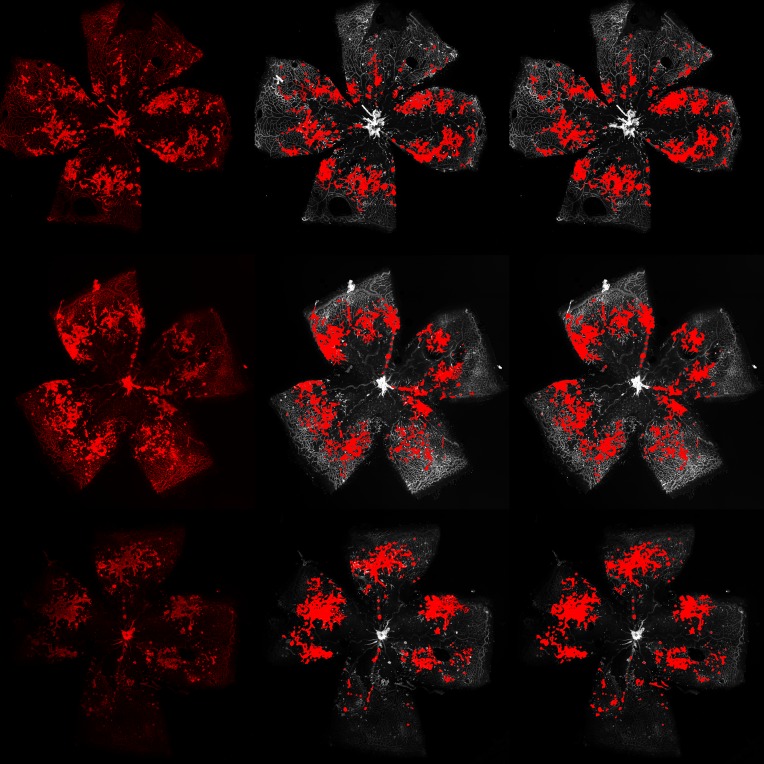
The neovascular tufts
Optical Coherence Tomography (OCT)
High-fidelity in vivo measurements of retinal structure at micron resolutionThe UW OCT/EMR data-base
10 years (2006-2016)
9,285 patients
43,328 OCT volumes
2.64 million OCT images
2.5 TB of data
Linked to EPIC electronic medical records
For each OCT we know:
Visual acuity
OCT interpretation
Diagnosis
Treatment determinations
In some cases - longitudinal measurements
Deep learning accurately classifies age-related macular degeneration (AMD)
Patient-level AUC = 0.97 (Lee et al., 2016)
Could a network learn to identify clinically-relevant features?
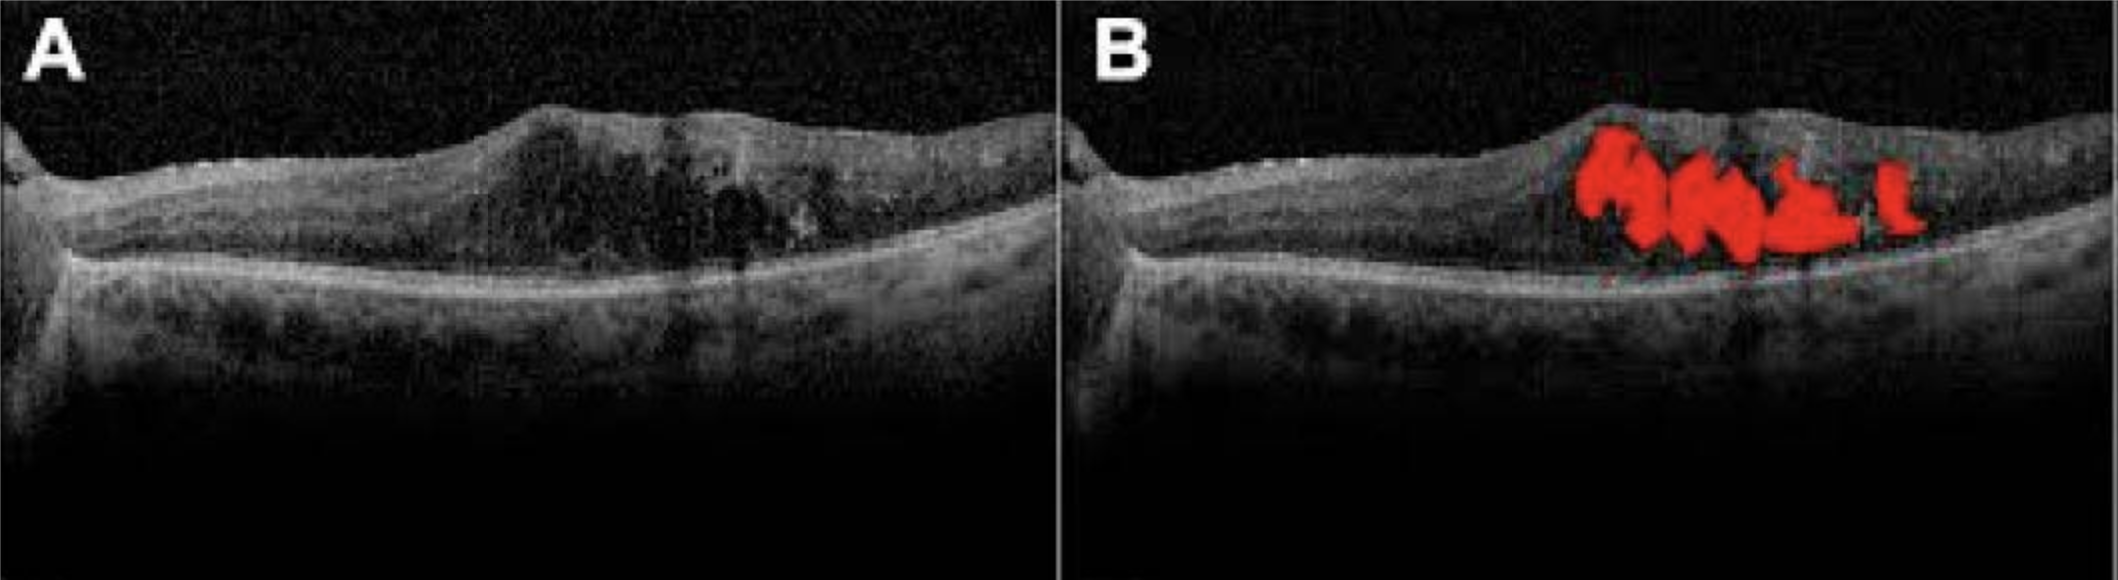
Detecting clinical features: intraretinal fluid segmentation
Detecting clinical features: intraretinal fluid segmentation
Detecting clinical features: intraretinal fluid segmentation
The solution
Expert → results
Expert → training data → machine learning → results
But: for many tasks, not enough training data
→ Amplify labeled data-sets with citizen science
Expert → citizen science → training data → machine learning → results
Scaling expertise with citizen science

Anisha Keshavan
(UW eScience → Child Mind Institute)

Jason Yeatman
(UW ILABS)
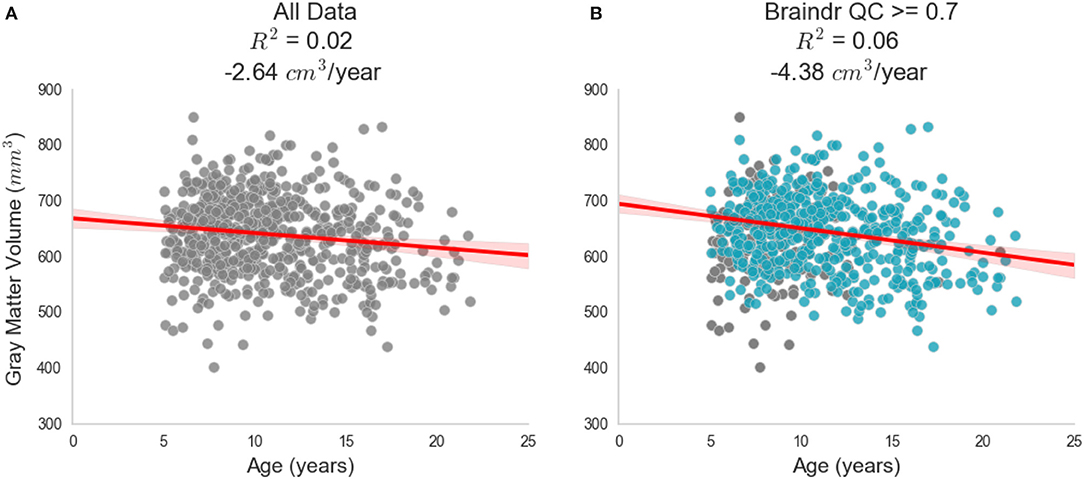
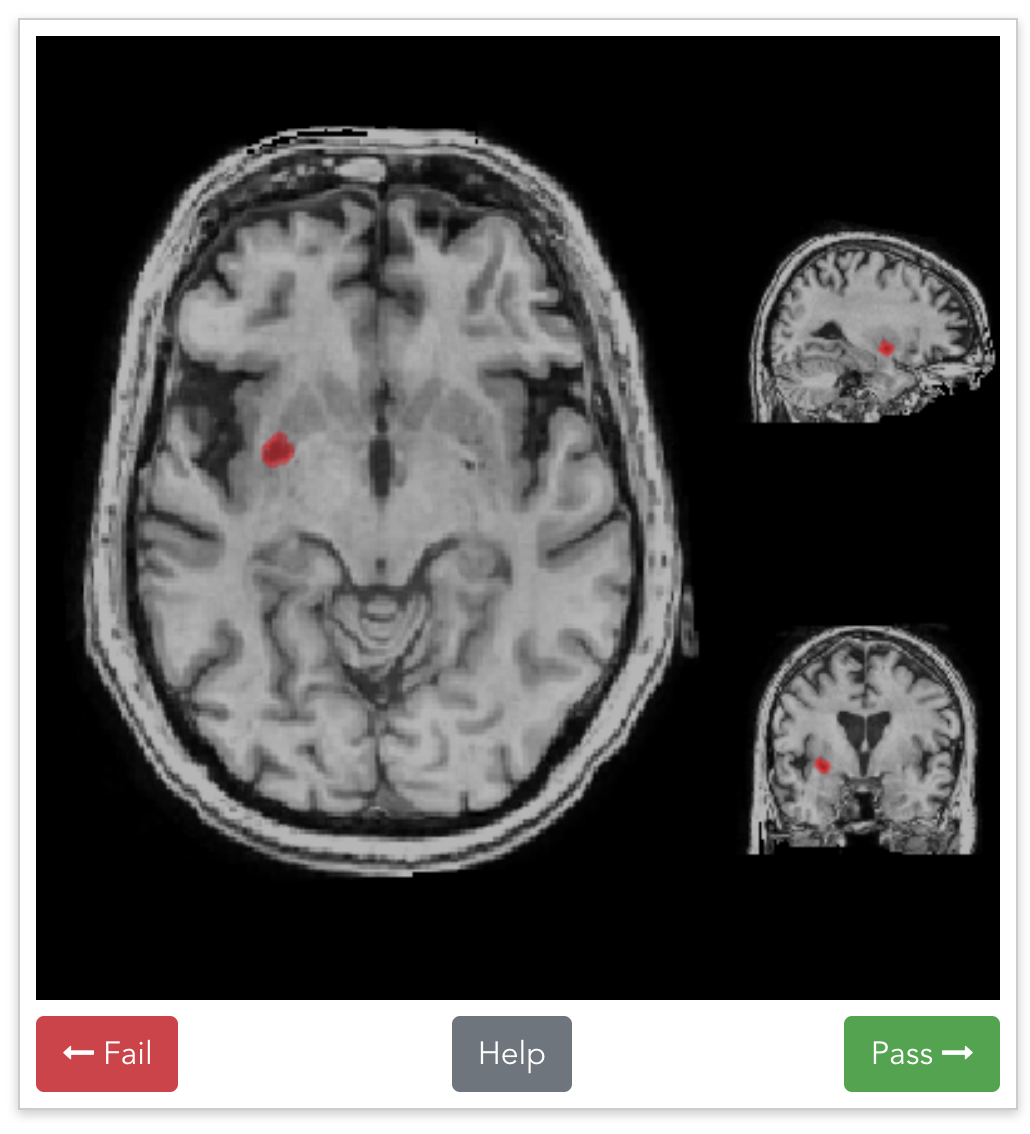
Quality of MRI images is a major bottleneck
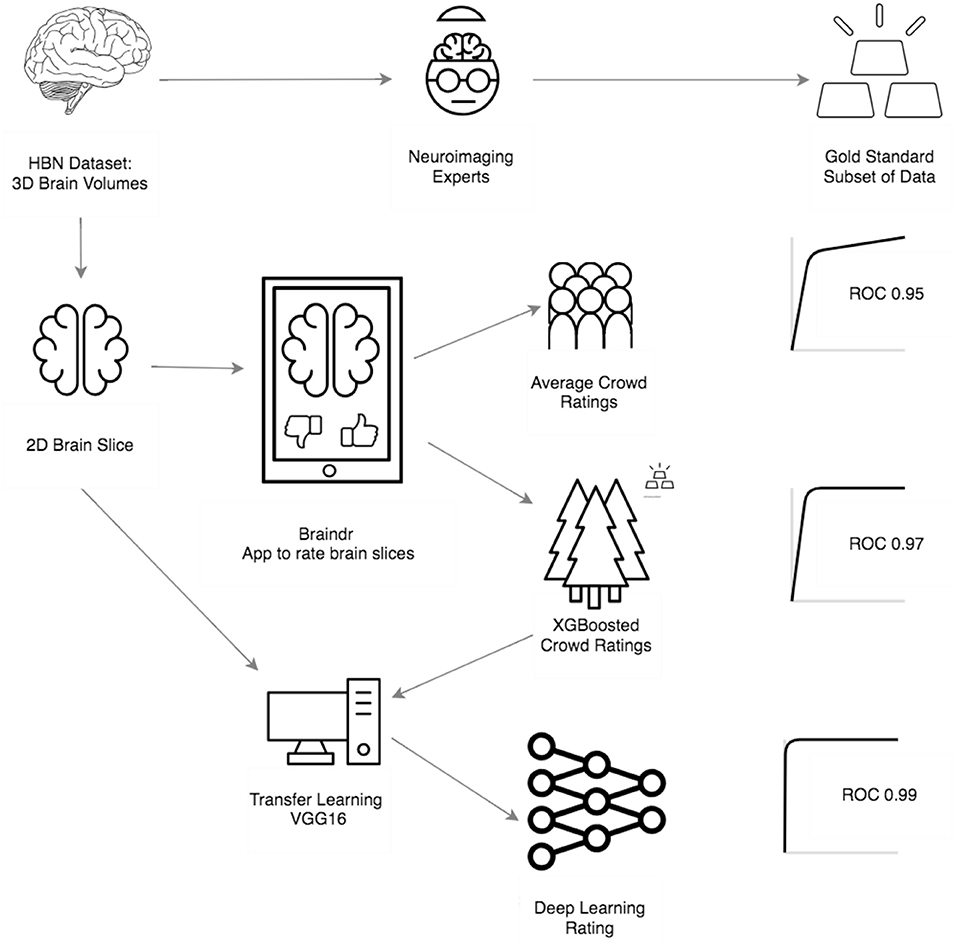
https://braindr.us
Are you at work but feel like playing Tinder? Why not play braindr (https://t.co/yXw191Q7Hy) instead, and help neuroscientists rate the quality of brain images? Swipe left to fail bad quality images! Built with @vuejs and @Firebase #citizenscience pic.twitter.com/tpI9Y3UKOb
— anisha (@akeshavan_) February 7, 2018
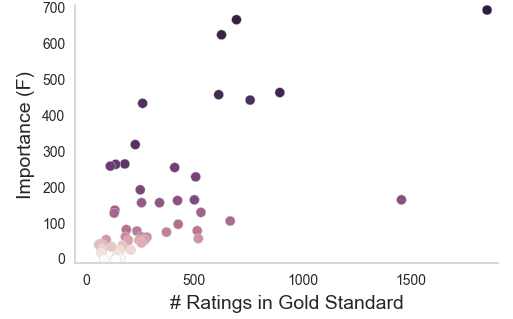
Multiple ratings per image
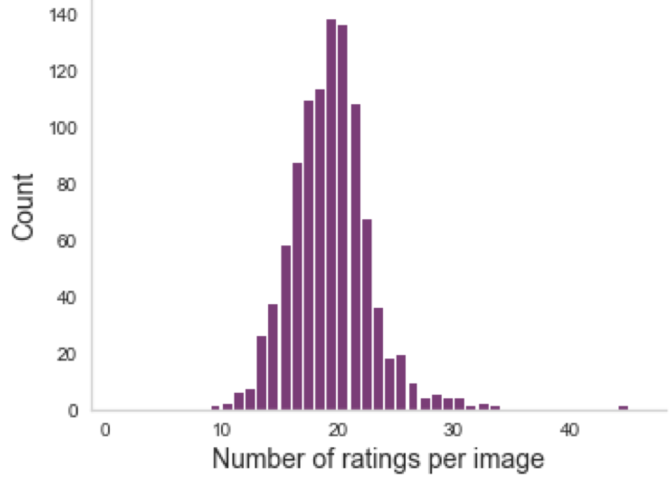
But often, no agreement
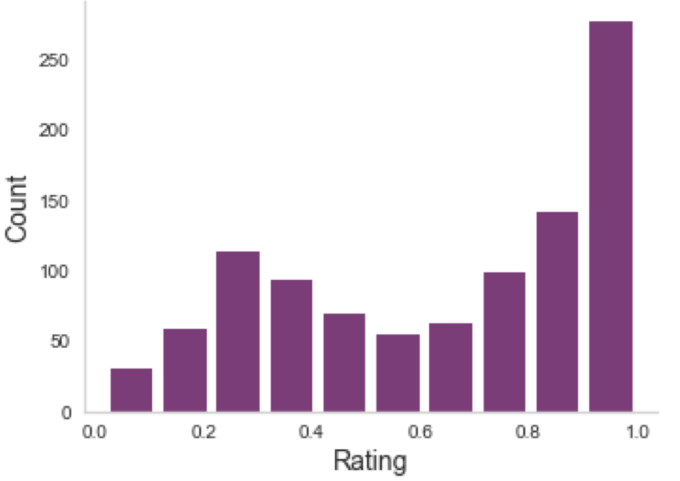
Aggregating across raters
XGBoost (Chen & Guestrin, 2016)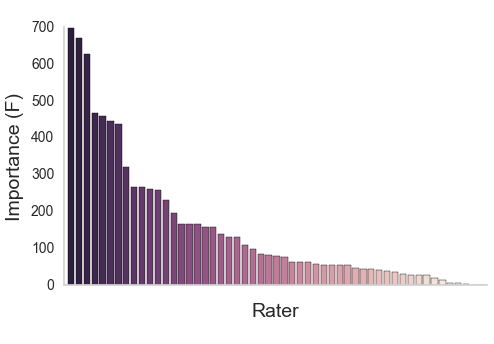
Aggregating across raters
Aggregating across raters
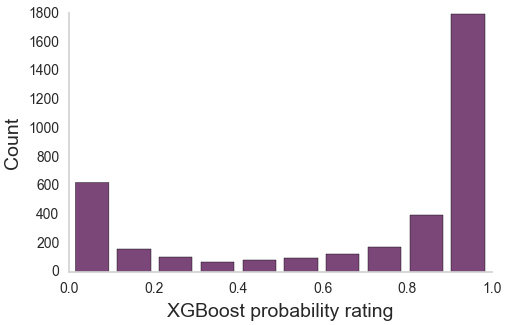
Aggregating across raters
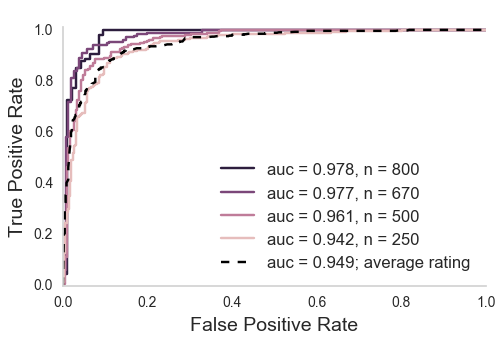
How do we scale this up?
Use images classified by citizen scientists as training data
Train a neural network on aggregated citizen scientist labels
Transfer learning with VGG16/ImageNet
Neural network matches expert performances
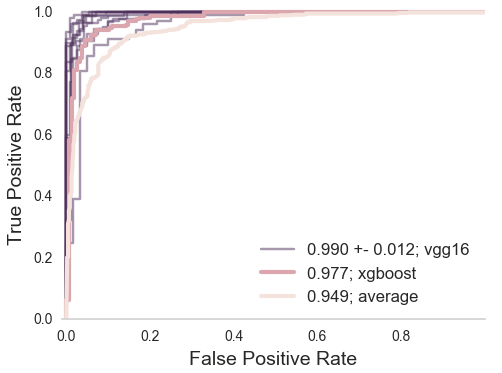
Does it matter?
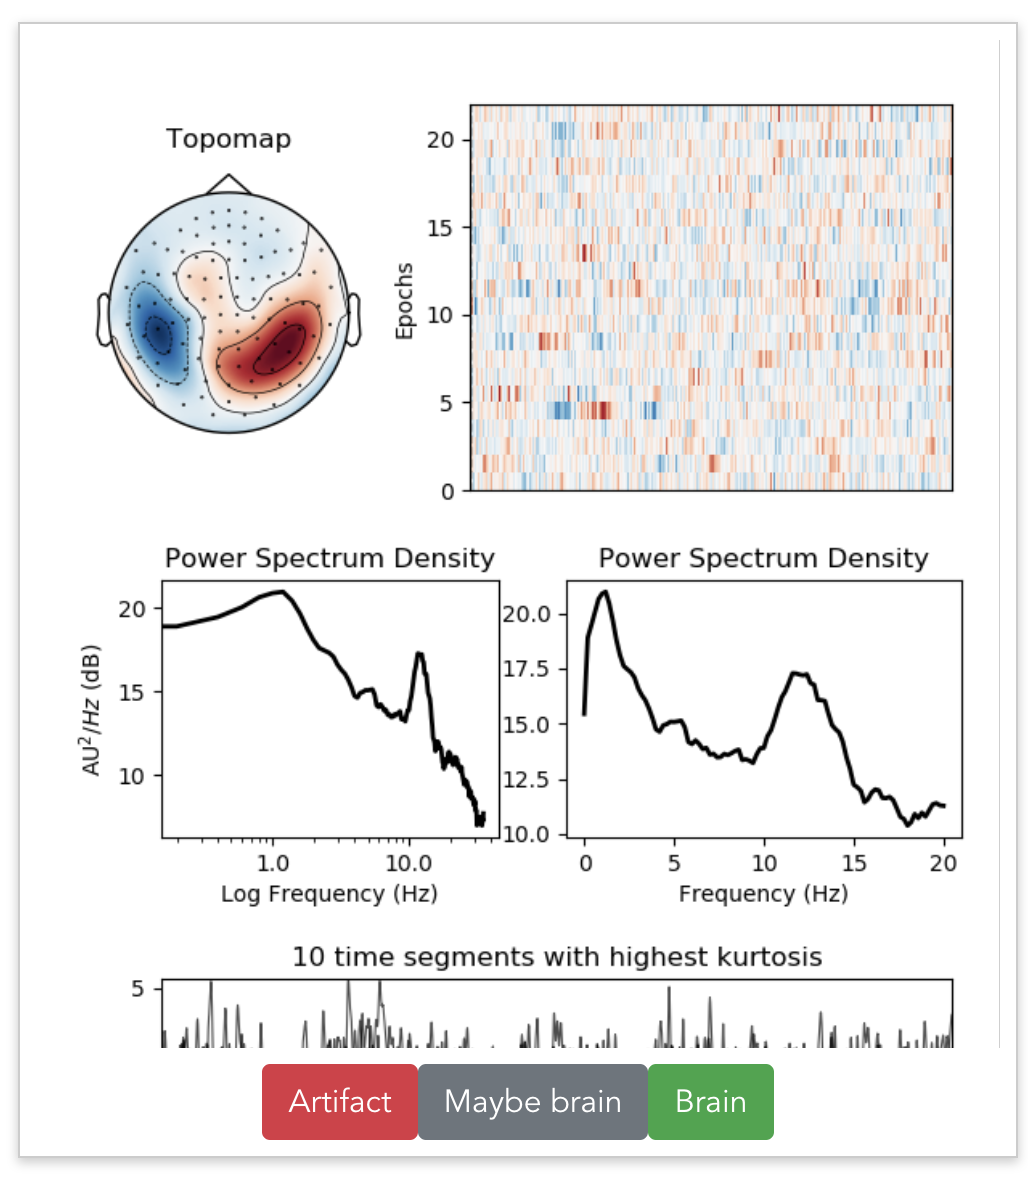
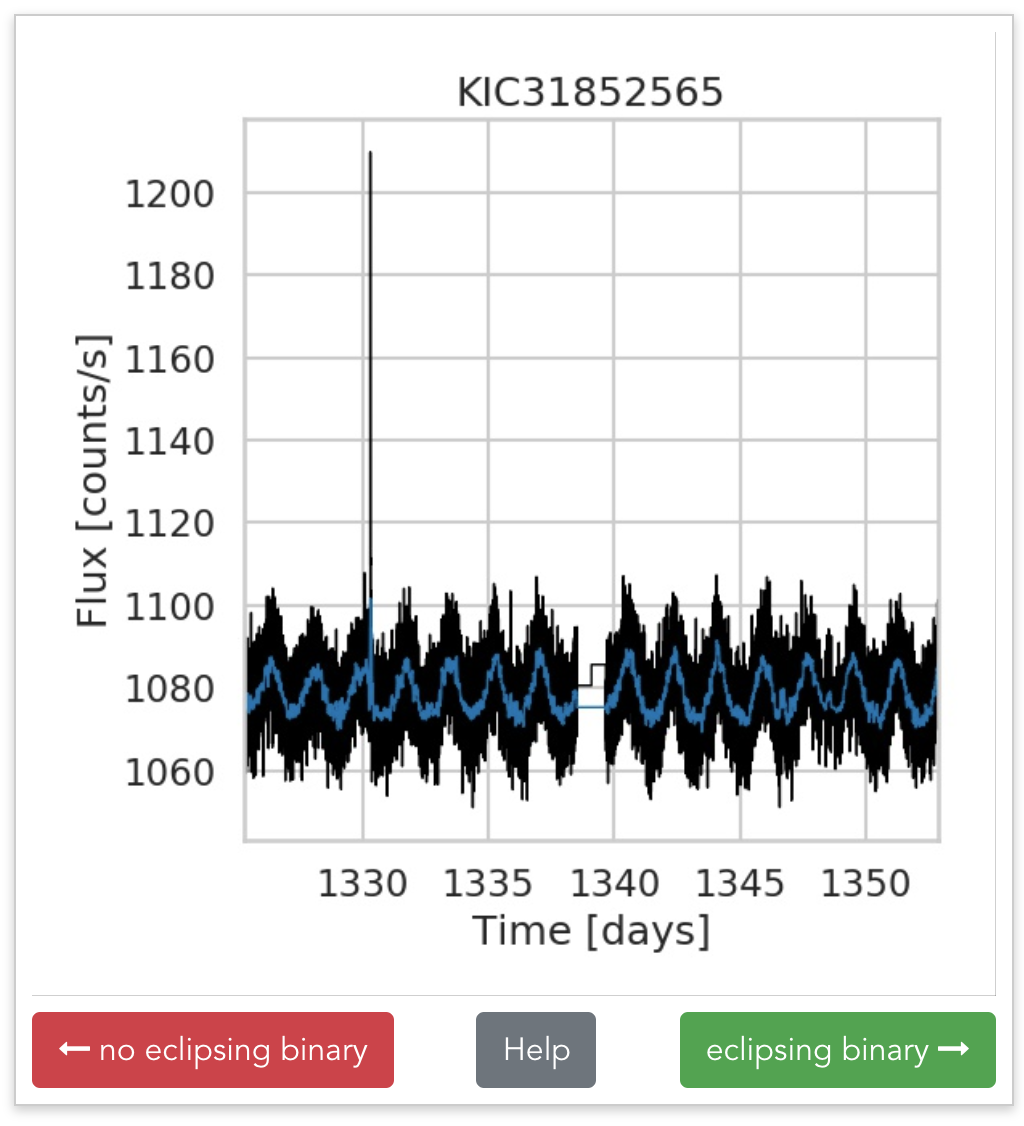
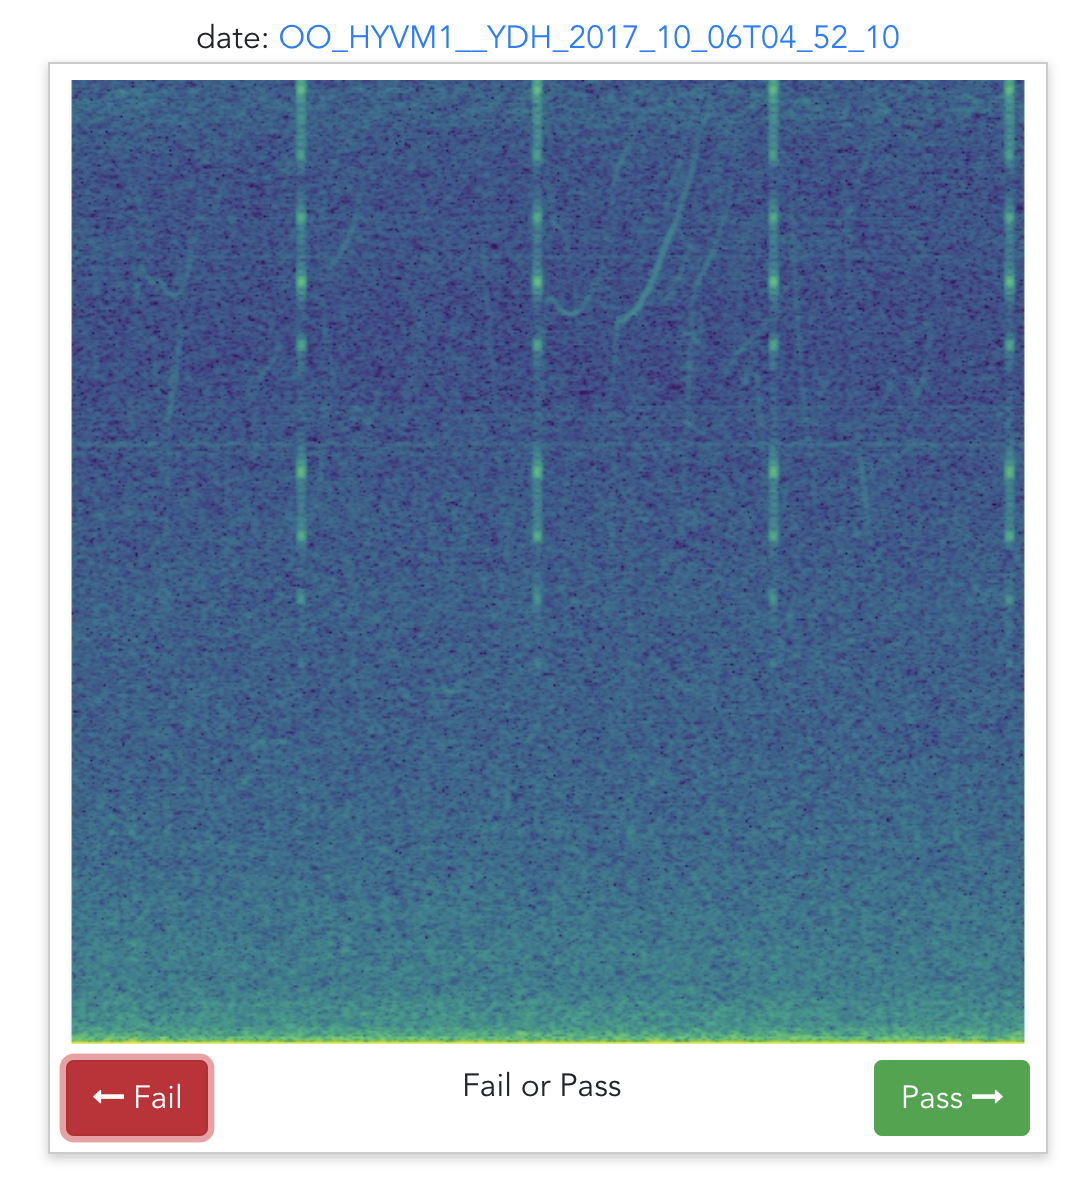
Democratizing citizen science
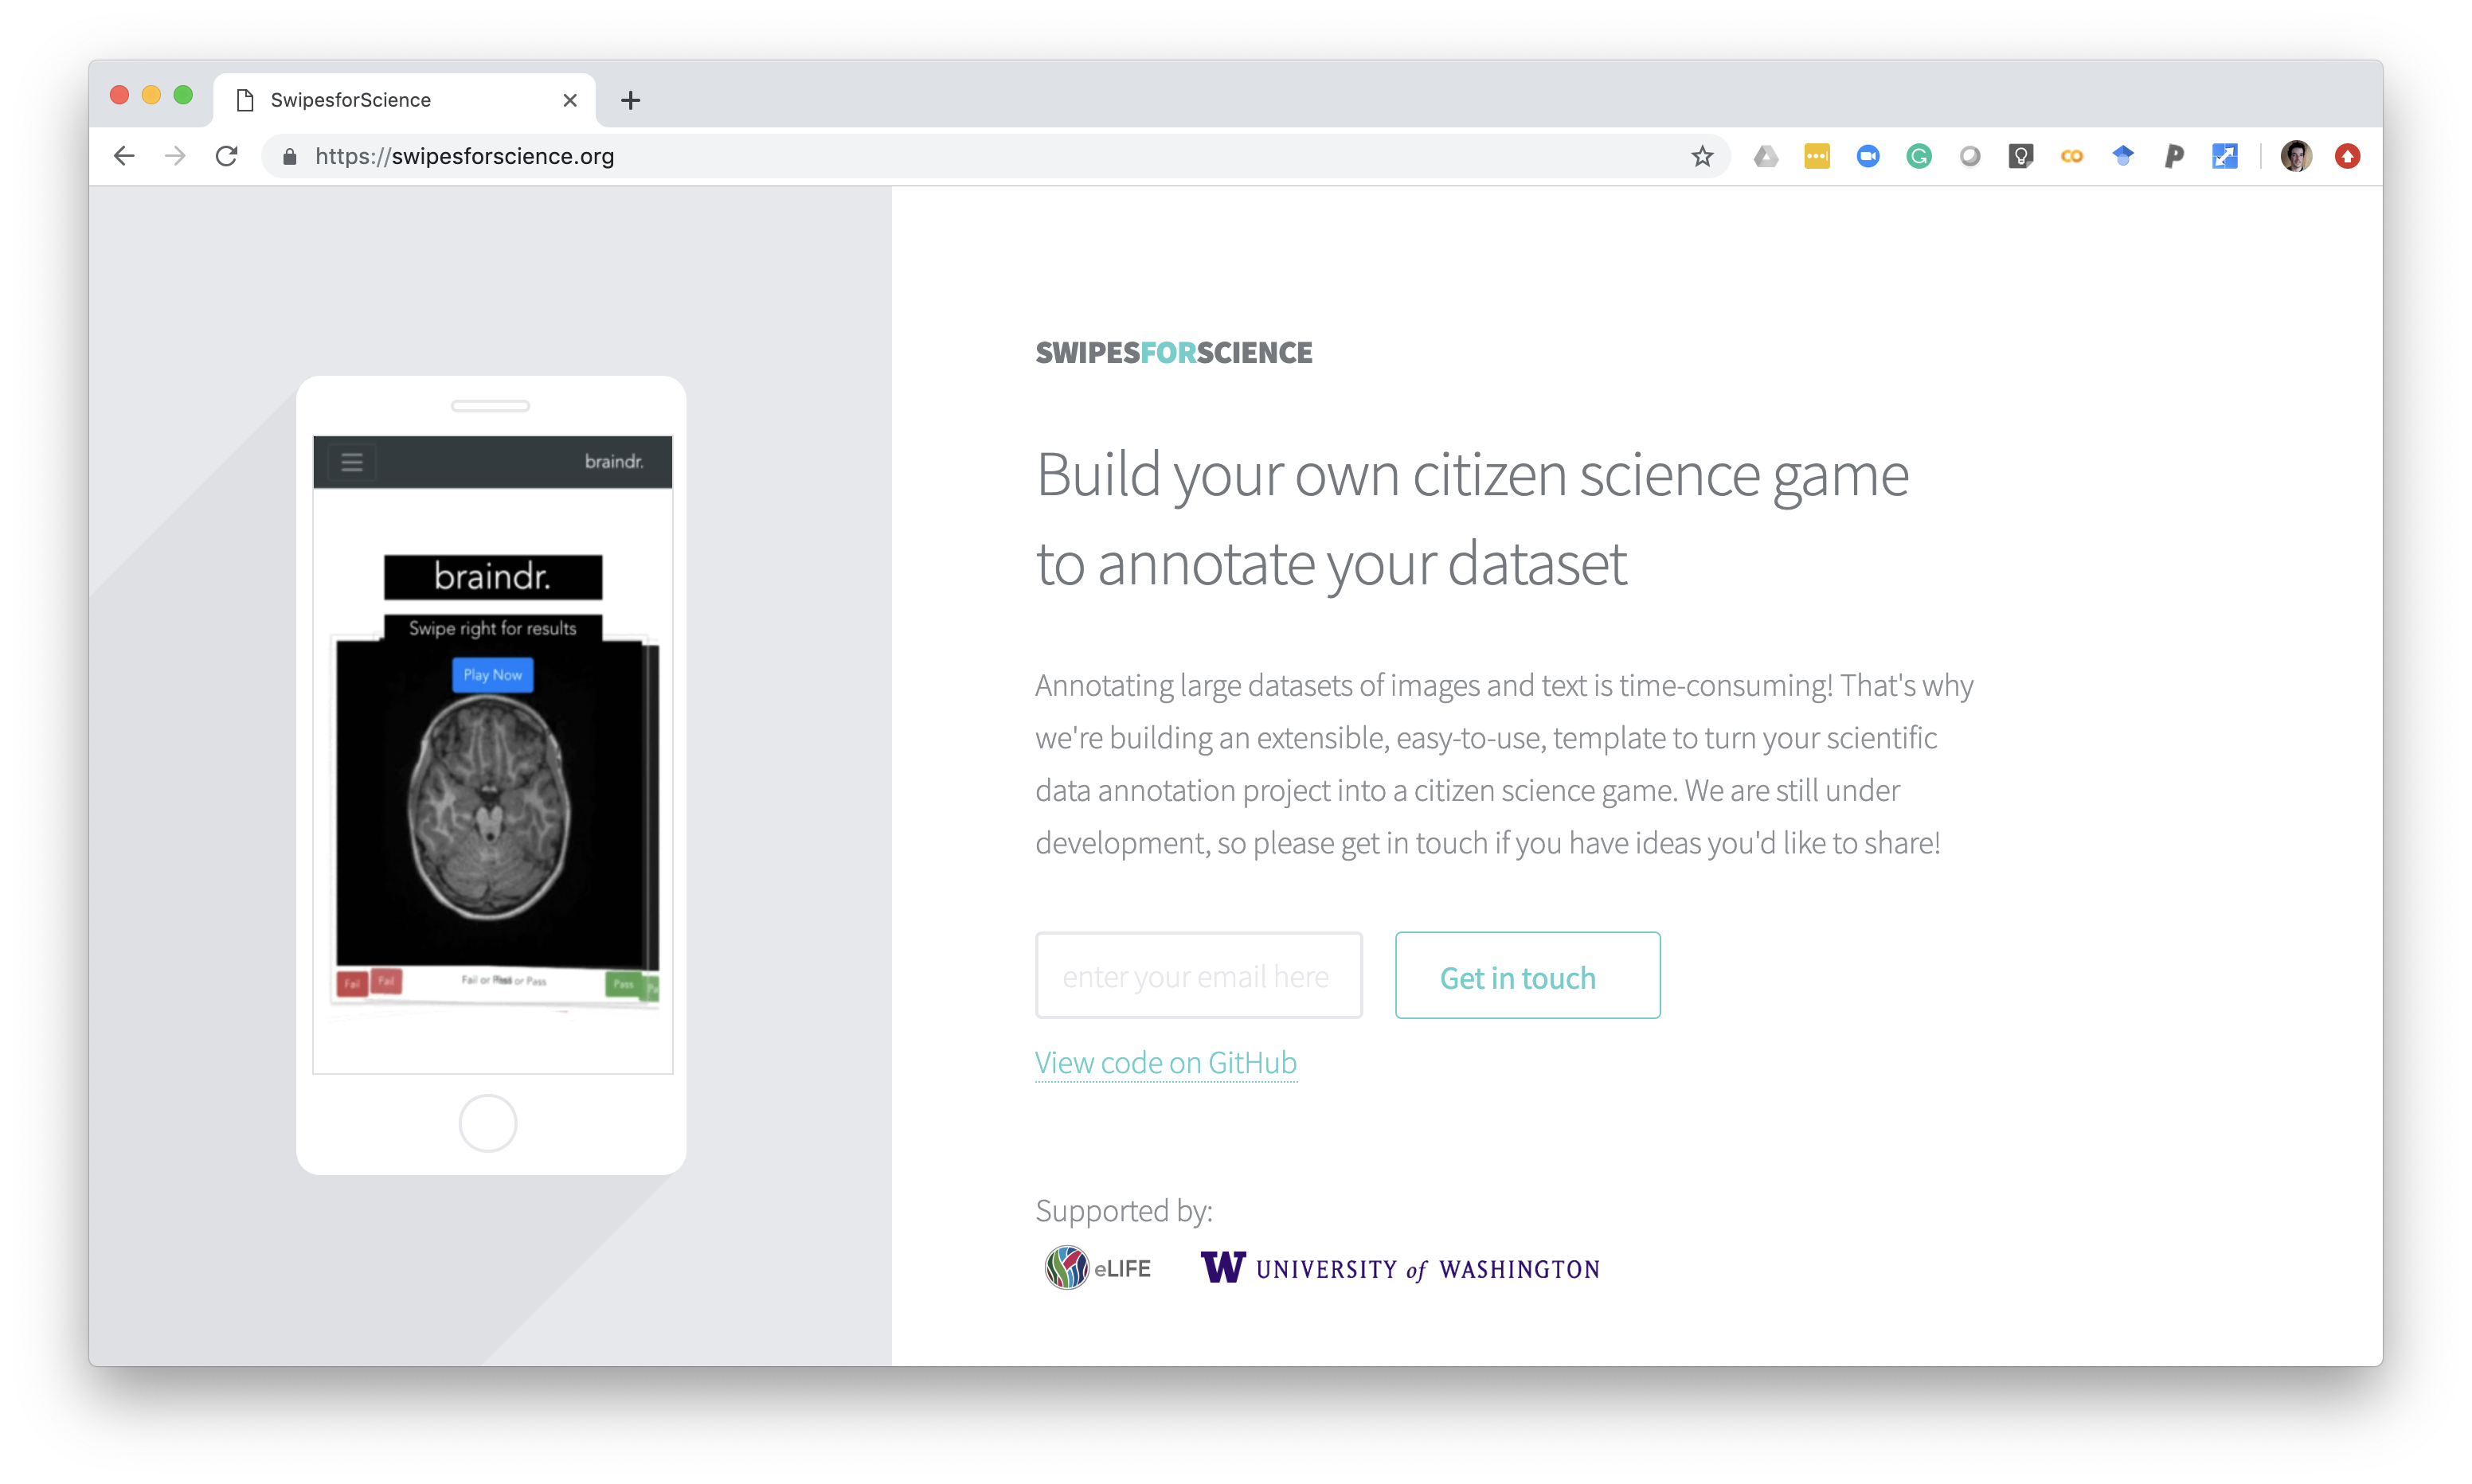
Democratizing citizen science
Swipes for Science
Beyond labeled data
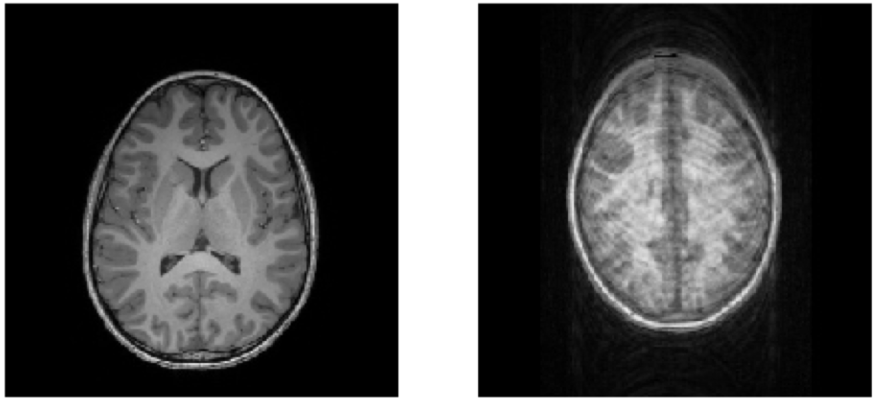
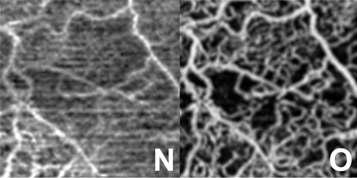
Discovering subtle relationships between different images of the same objectOCT → OCTA
OCT → OCTA
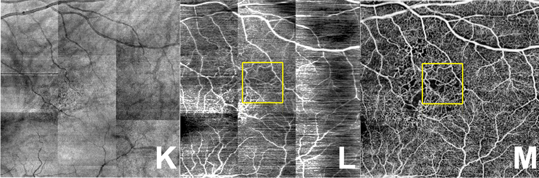
OCT → OCTA
MRI → MRI
Application: cross-modal image registration
Challenges
Scale
How do we adapt research to big datasets?
Use deep learning and citizen science
Complexity
How do we analyze and interpret multi-dimensional data?
Leverage machine learning techniques that use known brain structure
Socio-technical
How do we collaborate, publish and teach?
Open science: sharing data, software and training
Using machine learning to understand brain function
Accurately predict individual variability
Expose important biological features
Brain age
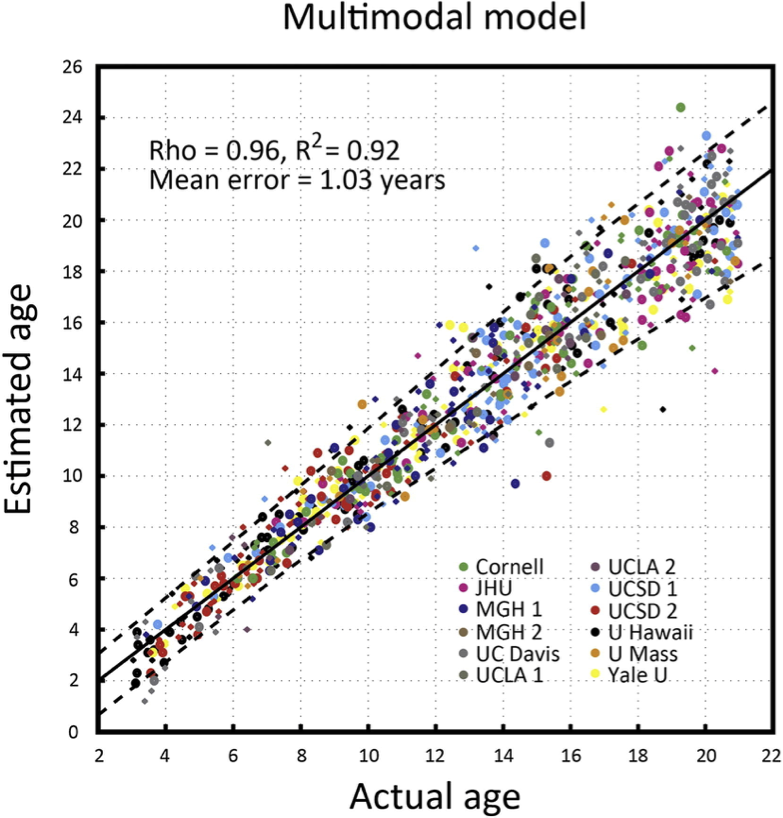
Age from brain networks
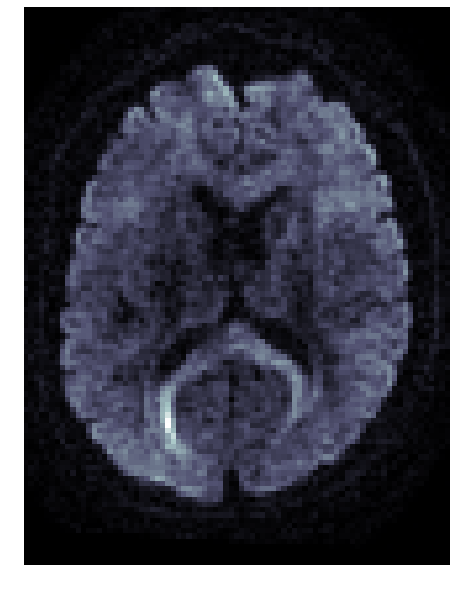
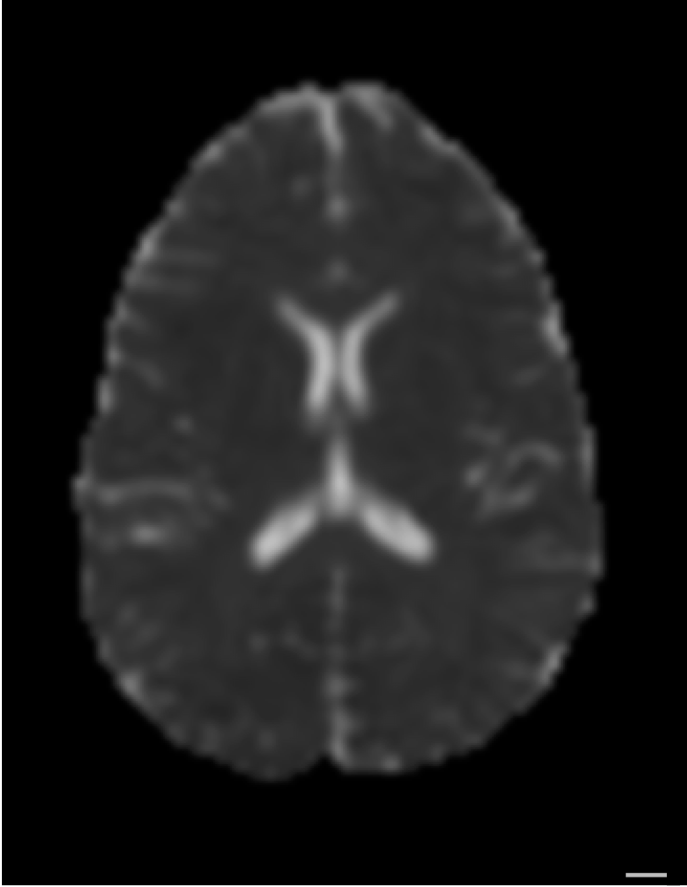
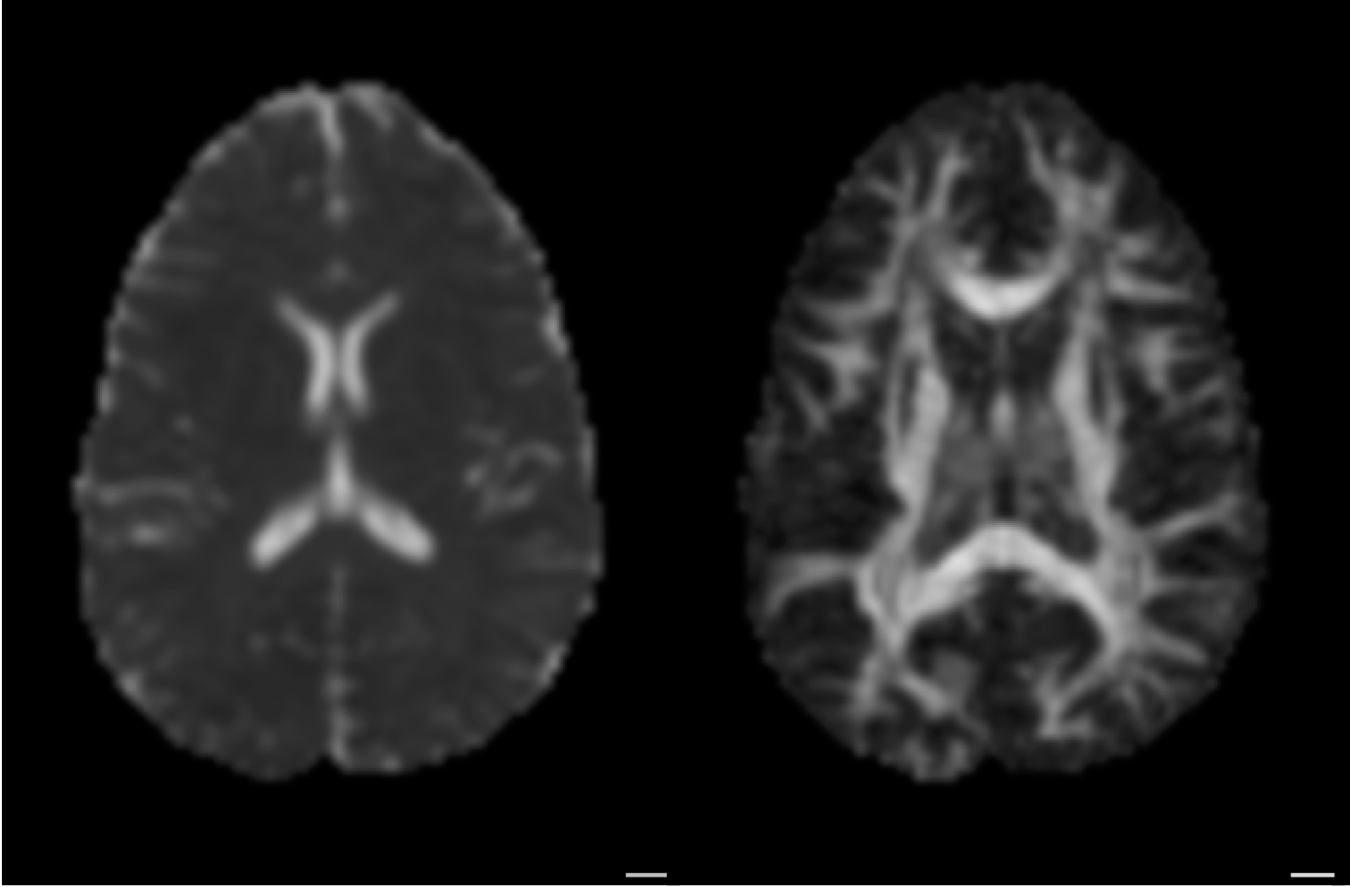
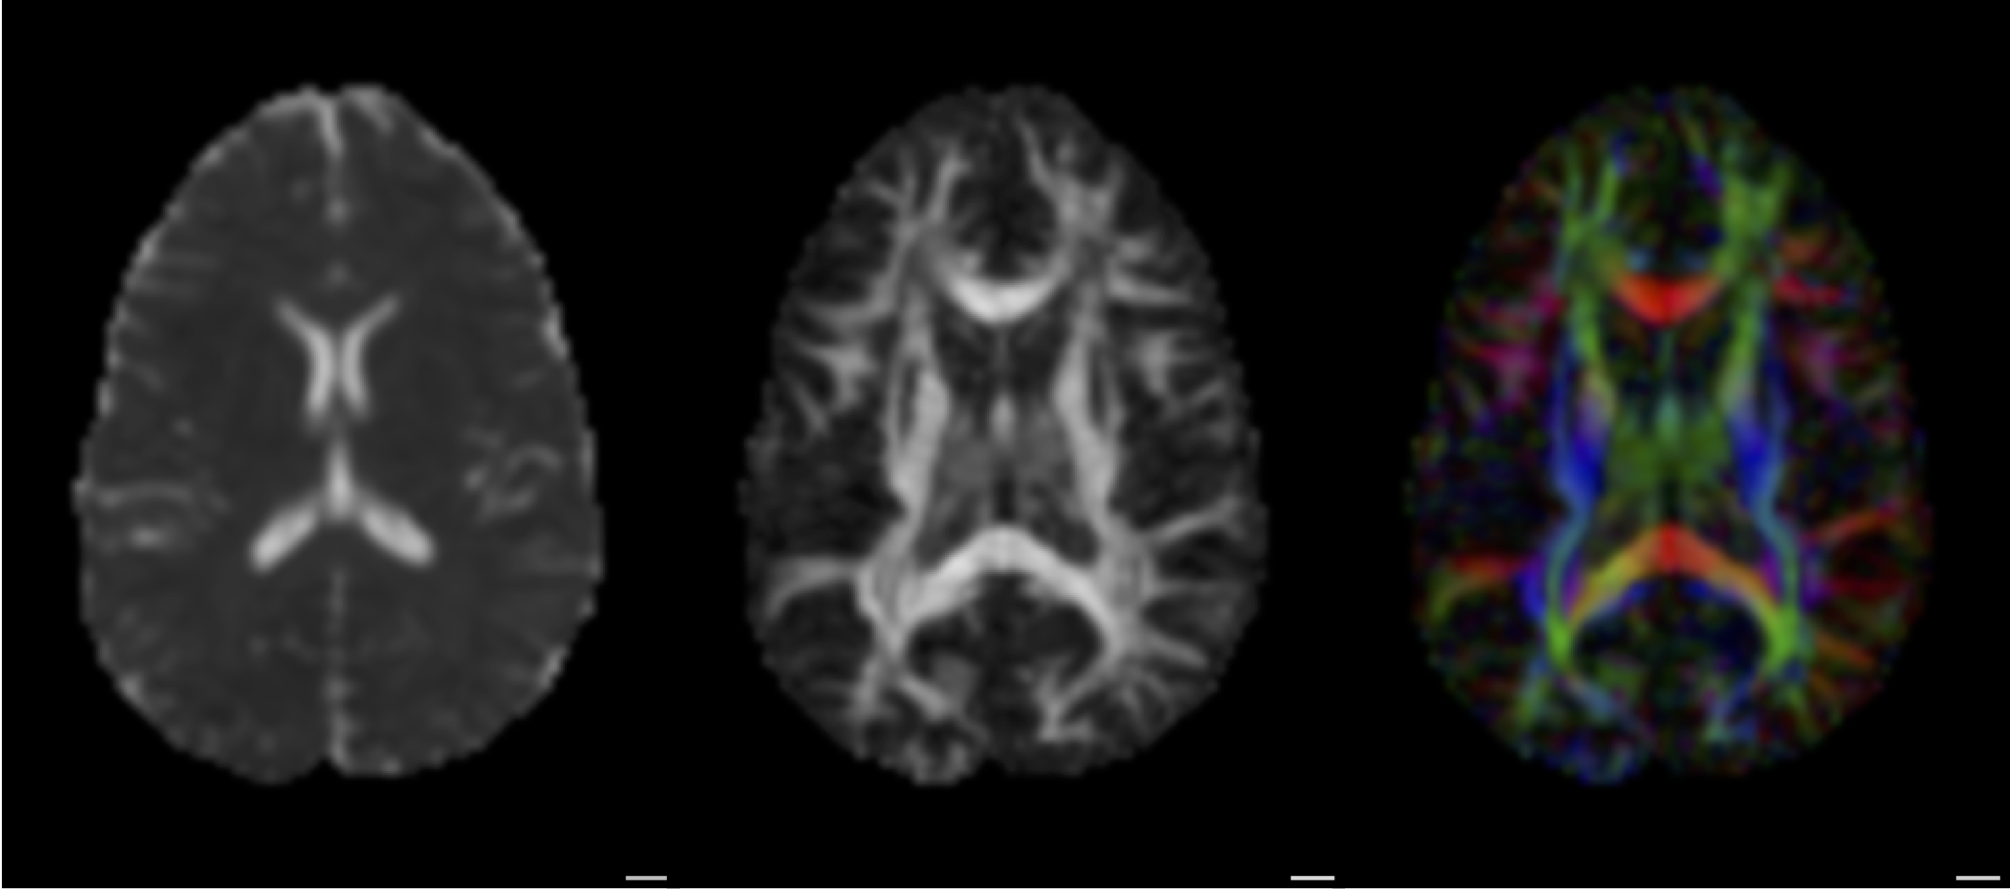
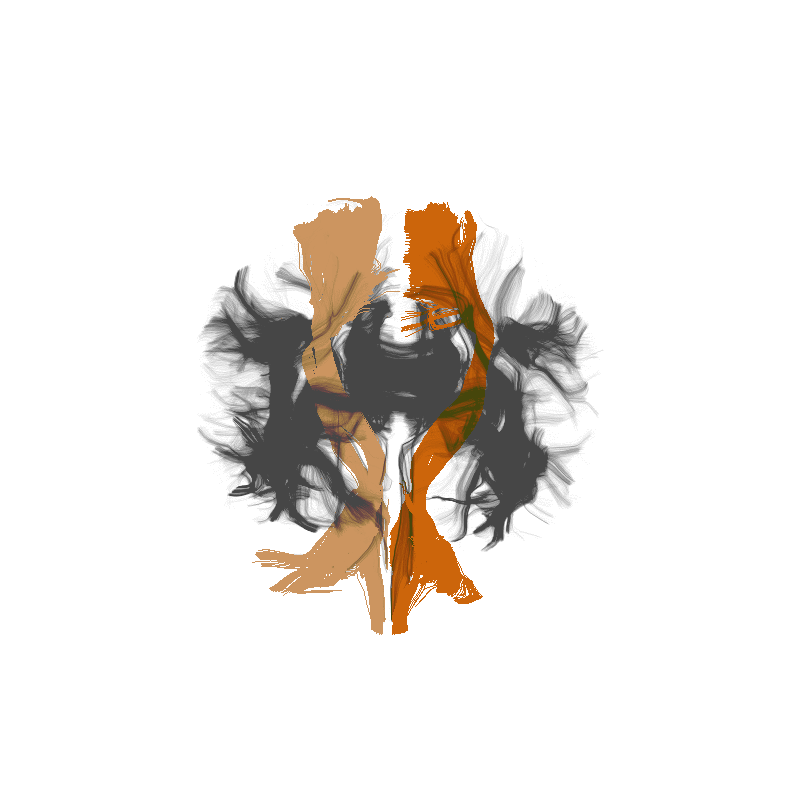
Diffusion MRI measures the physical properties of brain connections
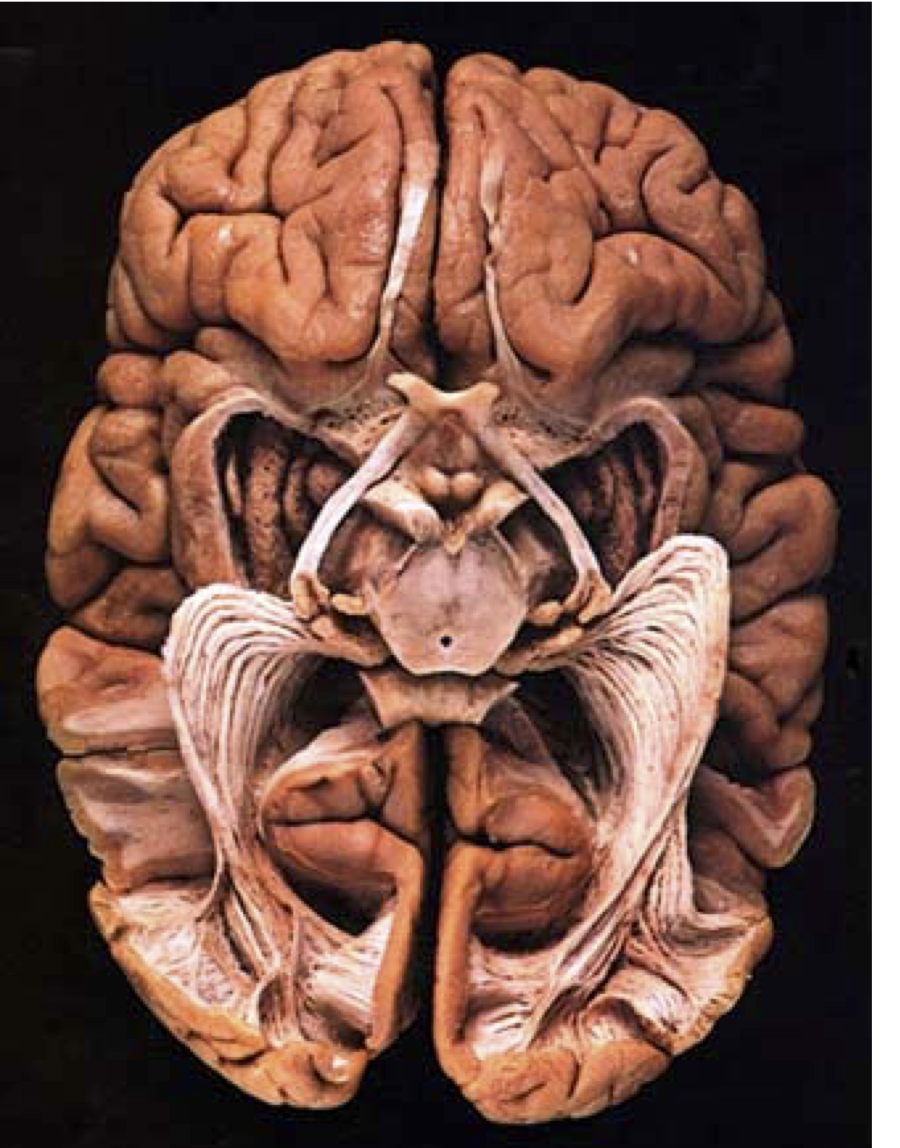
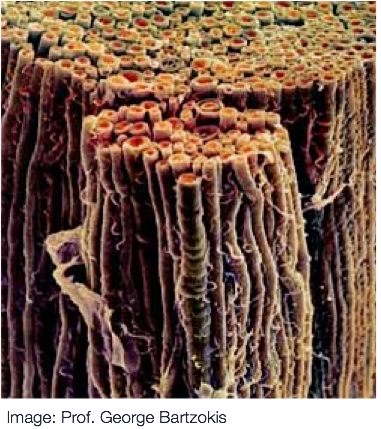
Diffusion MRI
Diffusion MRI
Diffusion MRI
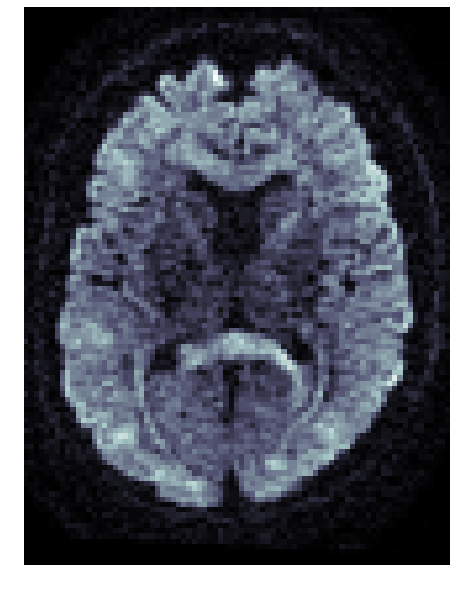
Diffusion MRI
Diffusion statistics

The 3D structure of each brain is unique
Tracts provide the anatomically correct coordinate frame
The 3D structure of each brain is unique
Tractometry is feature engineering
Tractometry is feature engineering
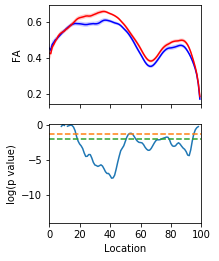
Amyotrophic Lateral Sclerosis (ALS)
The dilemma of standard statistical analysis
Mass univariate analysis: reduced statistical power
Focus on a region of interest: lose the full picture
A machine learning approach to model individual differences
Adam Richie-Halford
(UW eScience)
Noah Simon
(UW Biostats)
Jason Yeatman
(UW ILABS)
Solving diffusion MRI as a general linear model
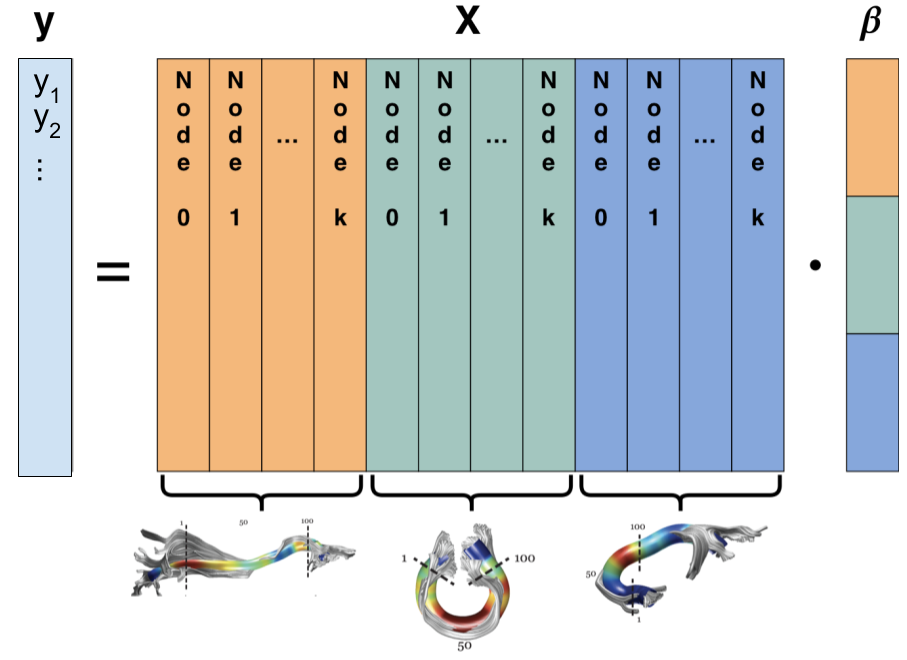
Solving diffusion MRI as a general linear model

The objective:

But in our case p (number of variables) >> n (number of subjects)
Regularization: the Lasso

Diffusion MRI data has group structure
The Group Lasso
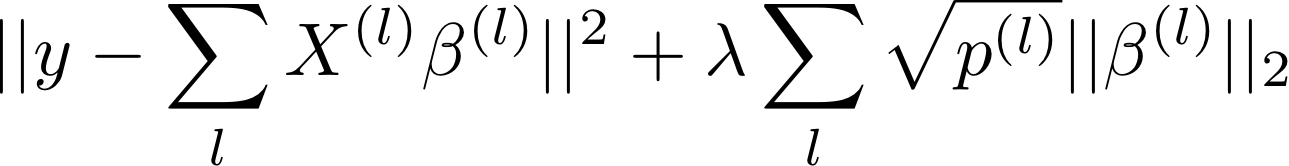
Where l are groups of variables
p(l) is the number of variables in group l
In our case: all the measurements of a tissue propetry within a tract
Enforces selection of groups
But does not enforce L1 sparsity within included groups
Sparse Group Lasso
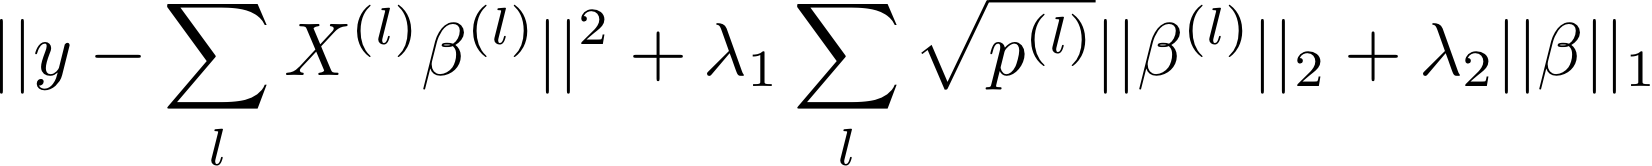
Enforces sparsity both at the group level and the within-group level
Subsumes the Lasso (λ1 = 0)
And the Group Lasso (λ2 = 0)
But more meta-parameters
→ Nested cross validation + hyperoptimization
Brain age
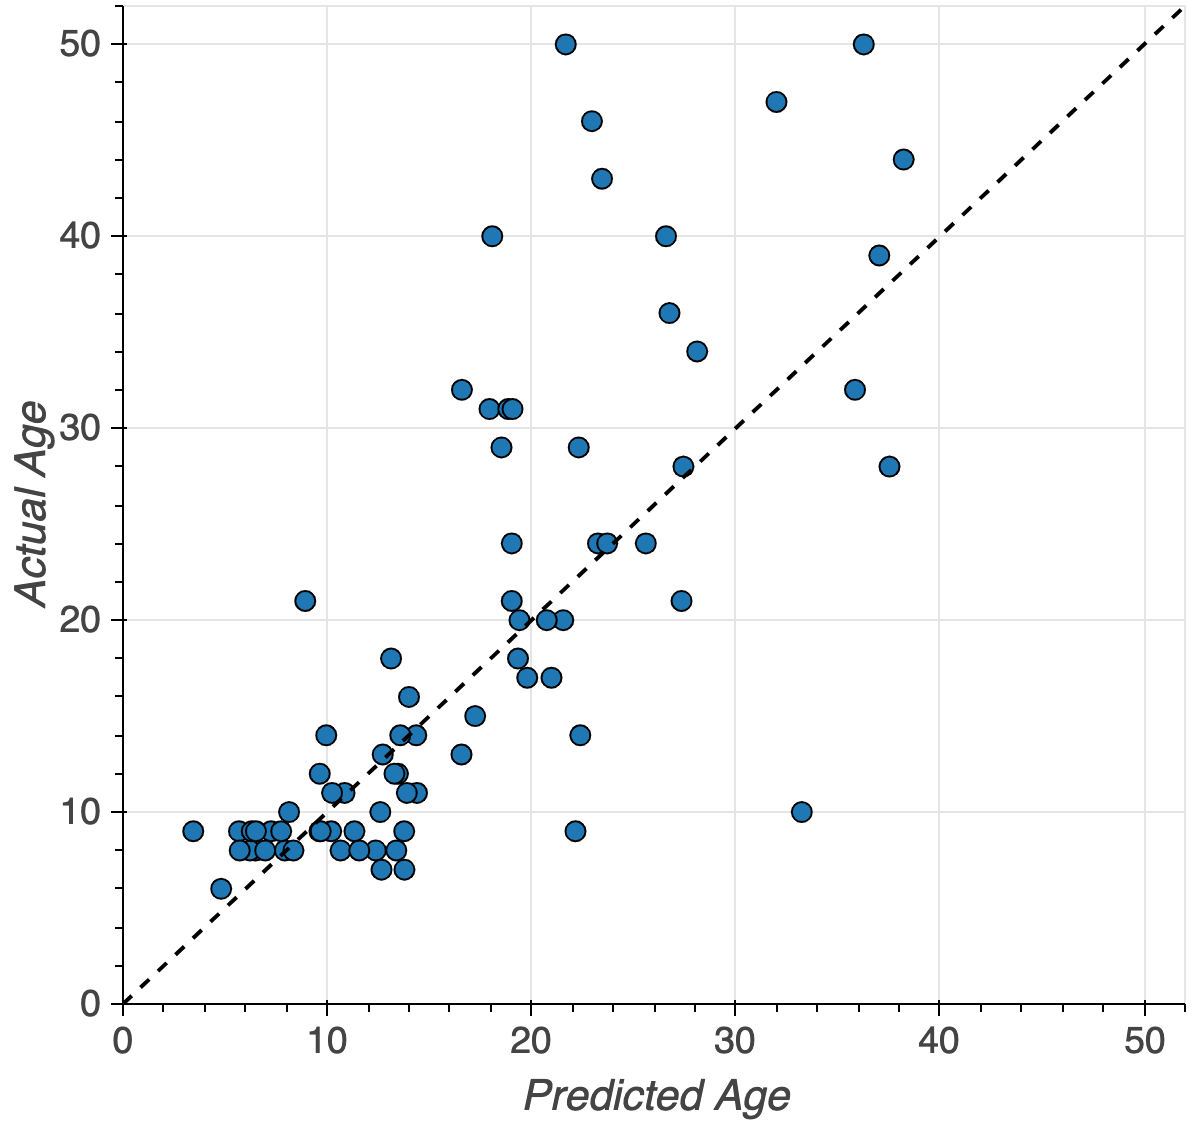
MAE: 4.2 years (+/- 2.7 years)
Multiple biological processes
Classification: logistic regression

Accurately classifies patients/controls
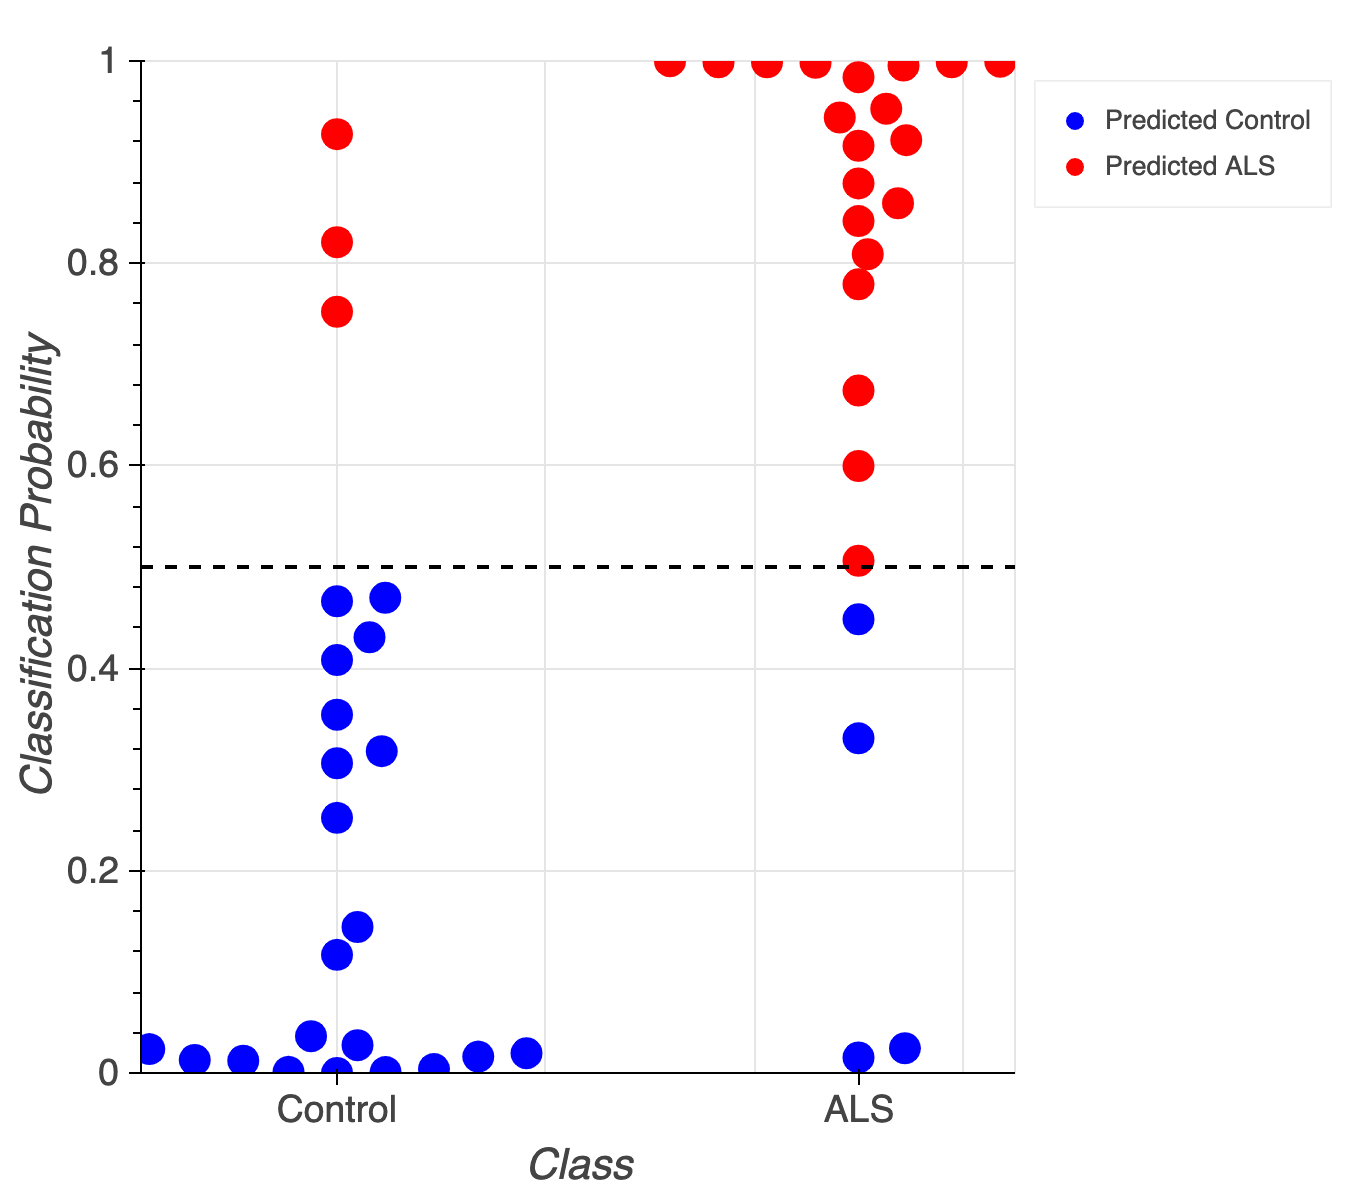
Classification accuracy of 84% (+/- 1%)
AUC of 0.91 (+/- 0.01)
Biological cause of ALS is localized
Sparse Group Lasso
Capitalizes on brain structure
Predicts continuous measures
(e.g, "brain age", reading skills)
Classifies of different states (patient/control)
Identifies dense or sparse biological feature sets
Future applications
Healthy Brain Network dataset
ABCD dataset
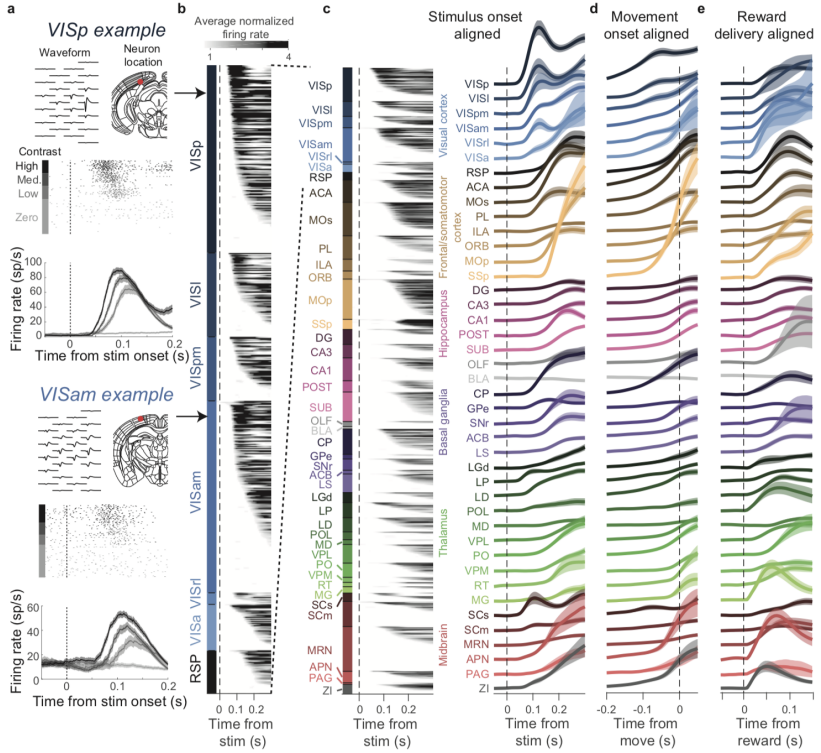
Multi-region, multi-neuron recordings
Neurons → features
Brain regions → groups
Trials → observations
Group structure in multi-neuron recordings
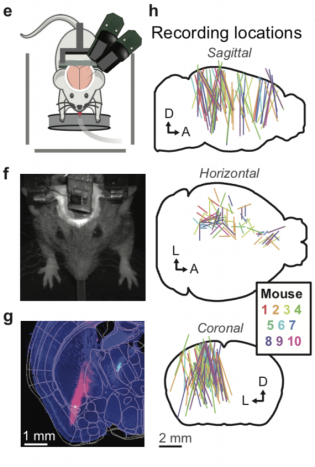
Group structure in multi-neuron recordings
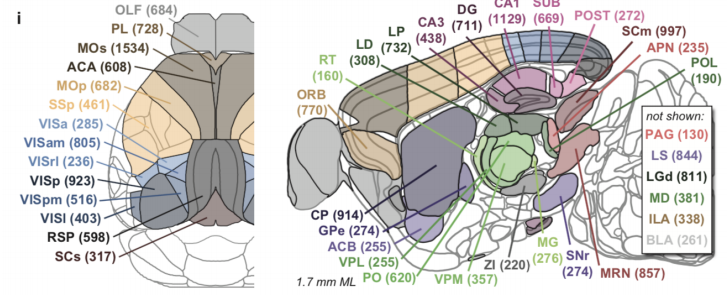
Group structure in multi-neuron recordings
Challenges
Scale
How do we adapt research to big datasets?
Use deep learning and citizen science
Complexity
How do we analyze and interpret multi-dimensional data?
Leverage machine learning techniques that use known brain structure
Socio-technical
How do we collaborate, publish and teach?
Open science: sharing data, software and training
Challenge: how do we incentivize data sharing?
Data sharing is not incentivized and is not easy enough
Results from large multi-dimensional datasets are hard to understand
Hard to communicate
Hard to reproduce
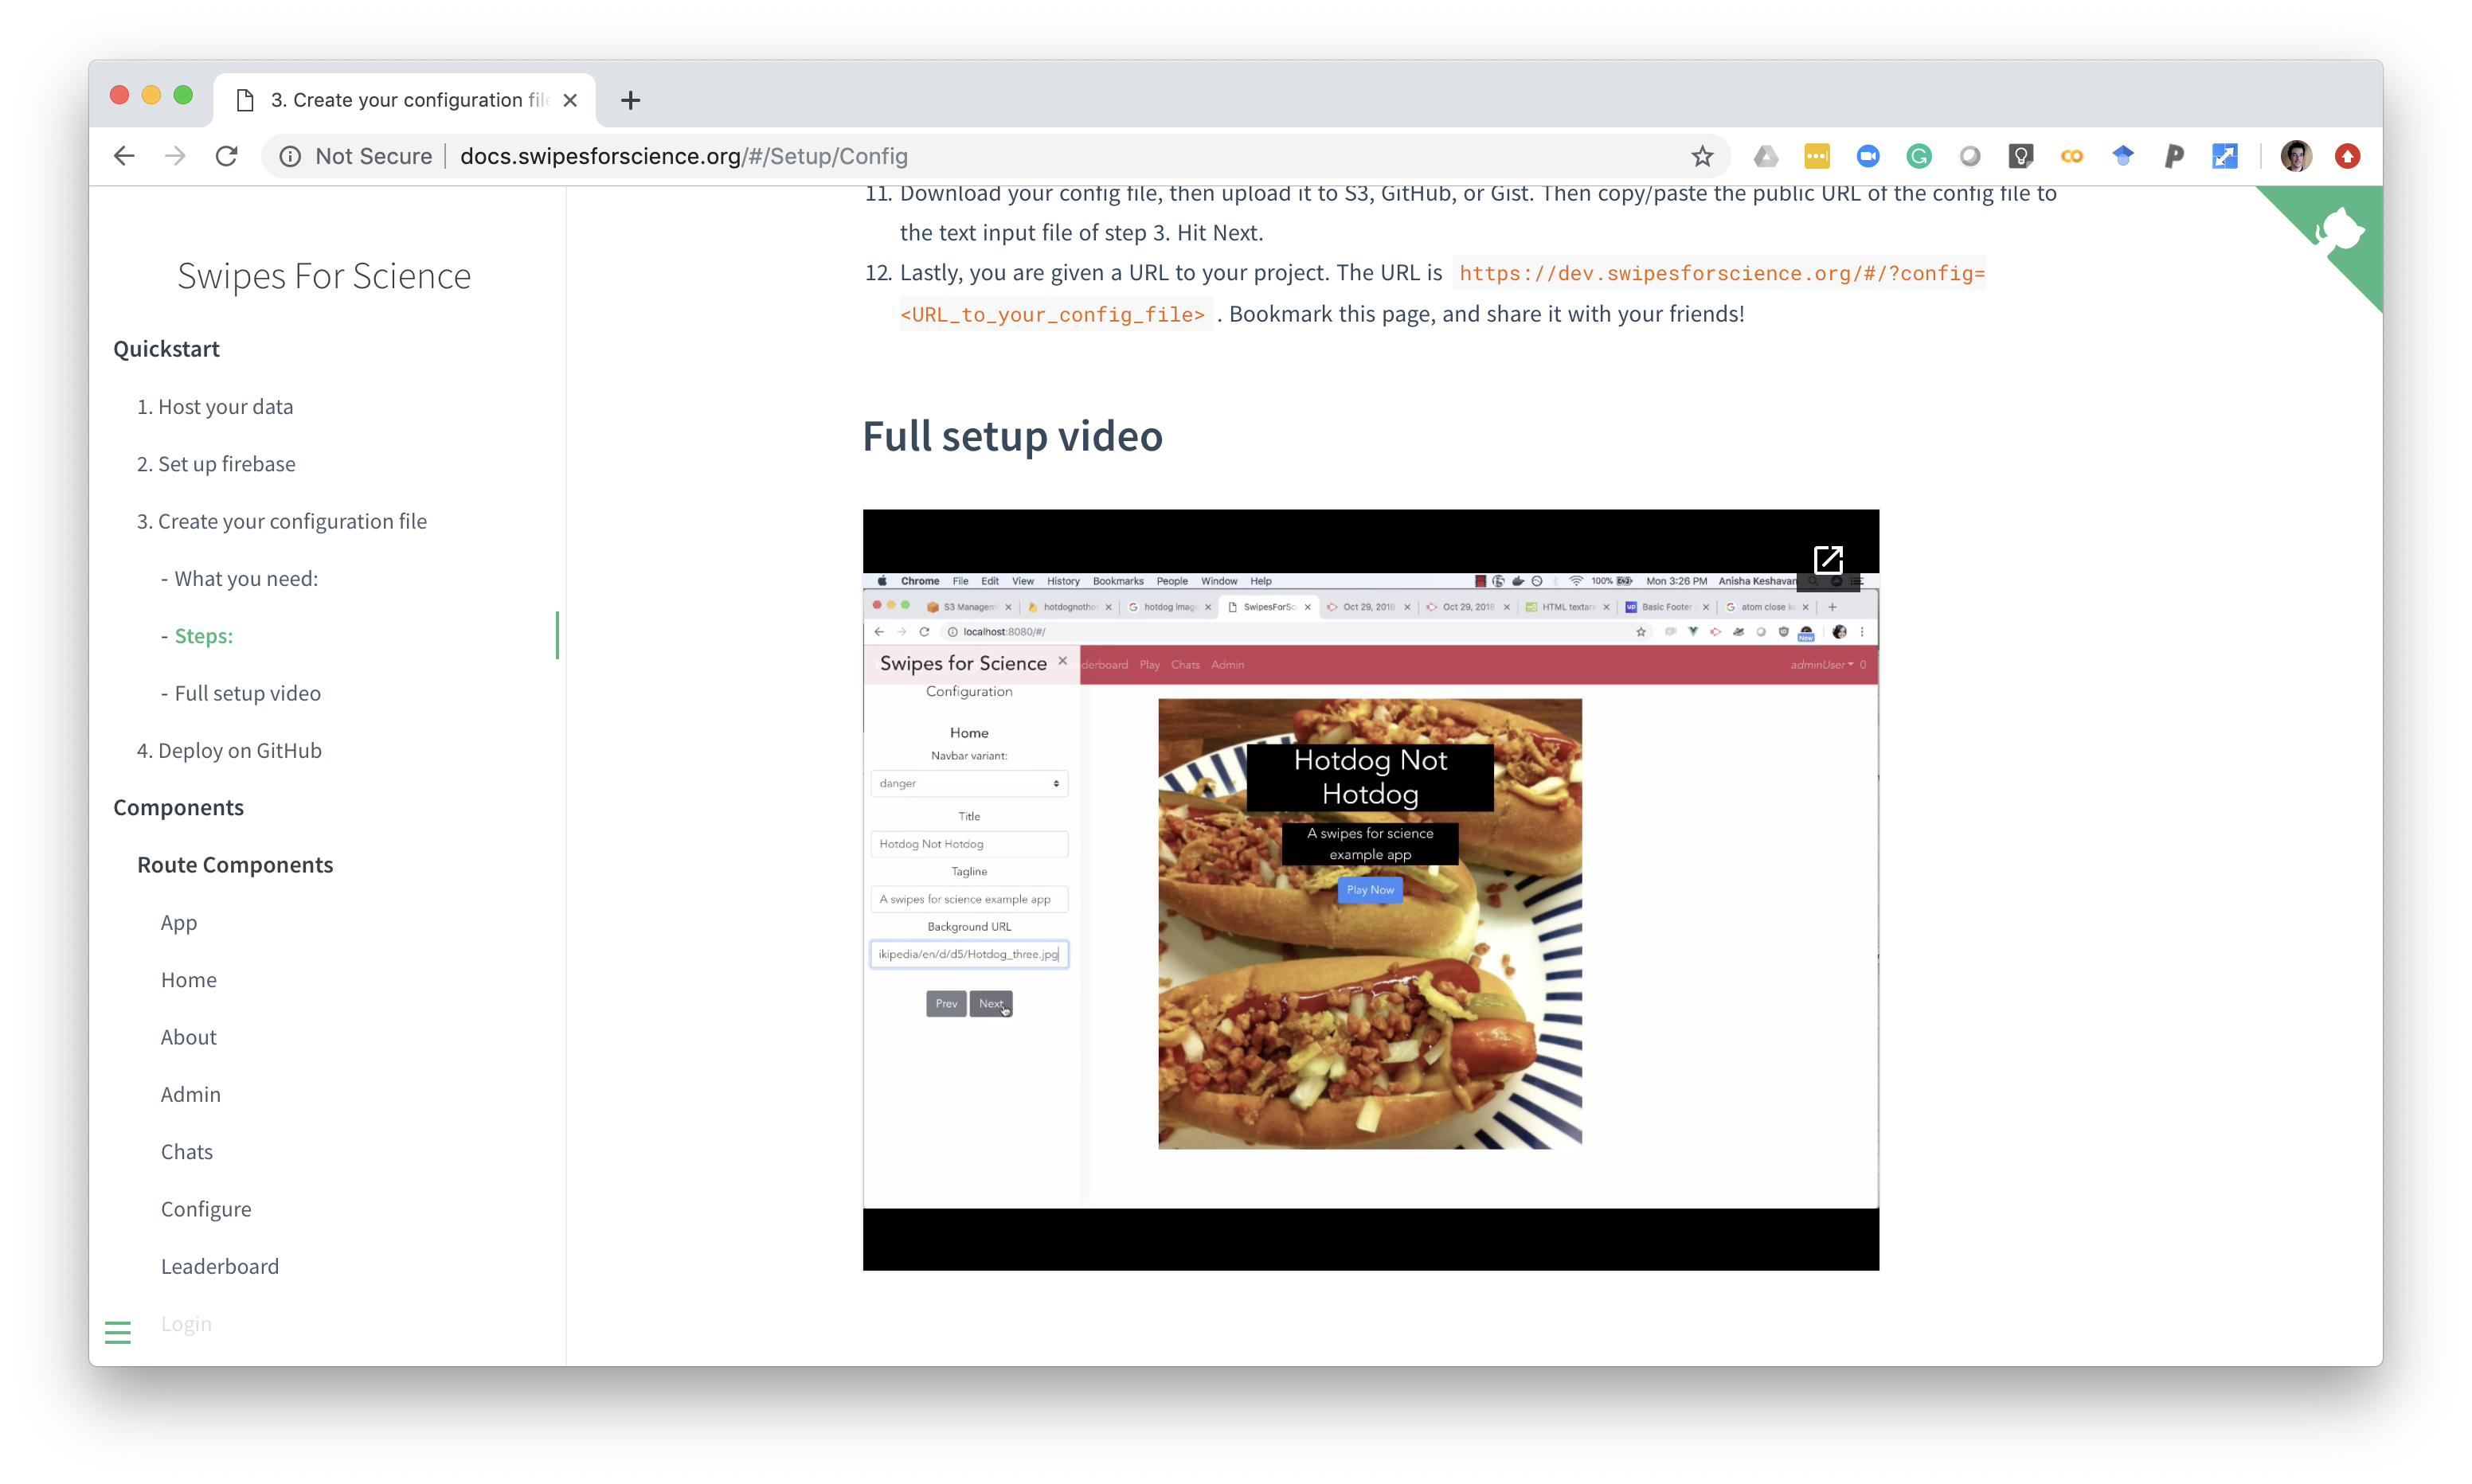
Solution: tools for exploration with data sharing built in!
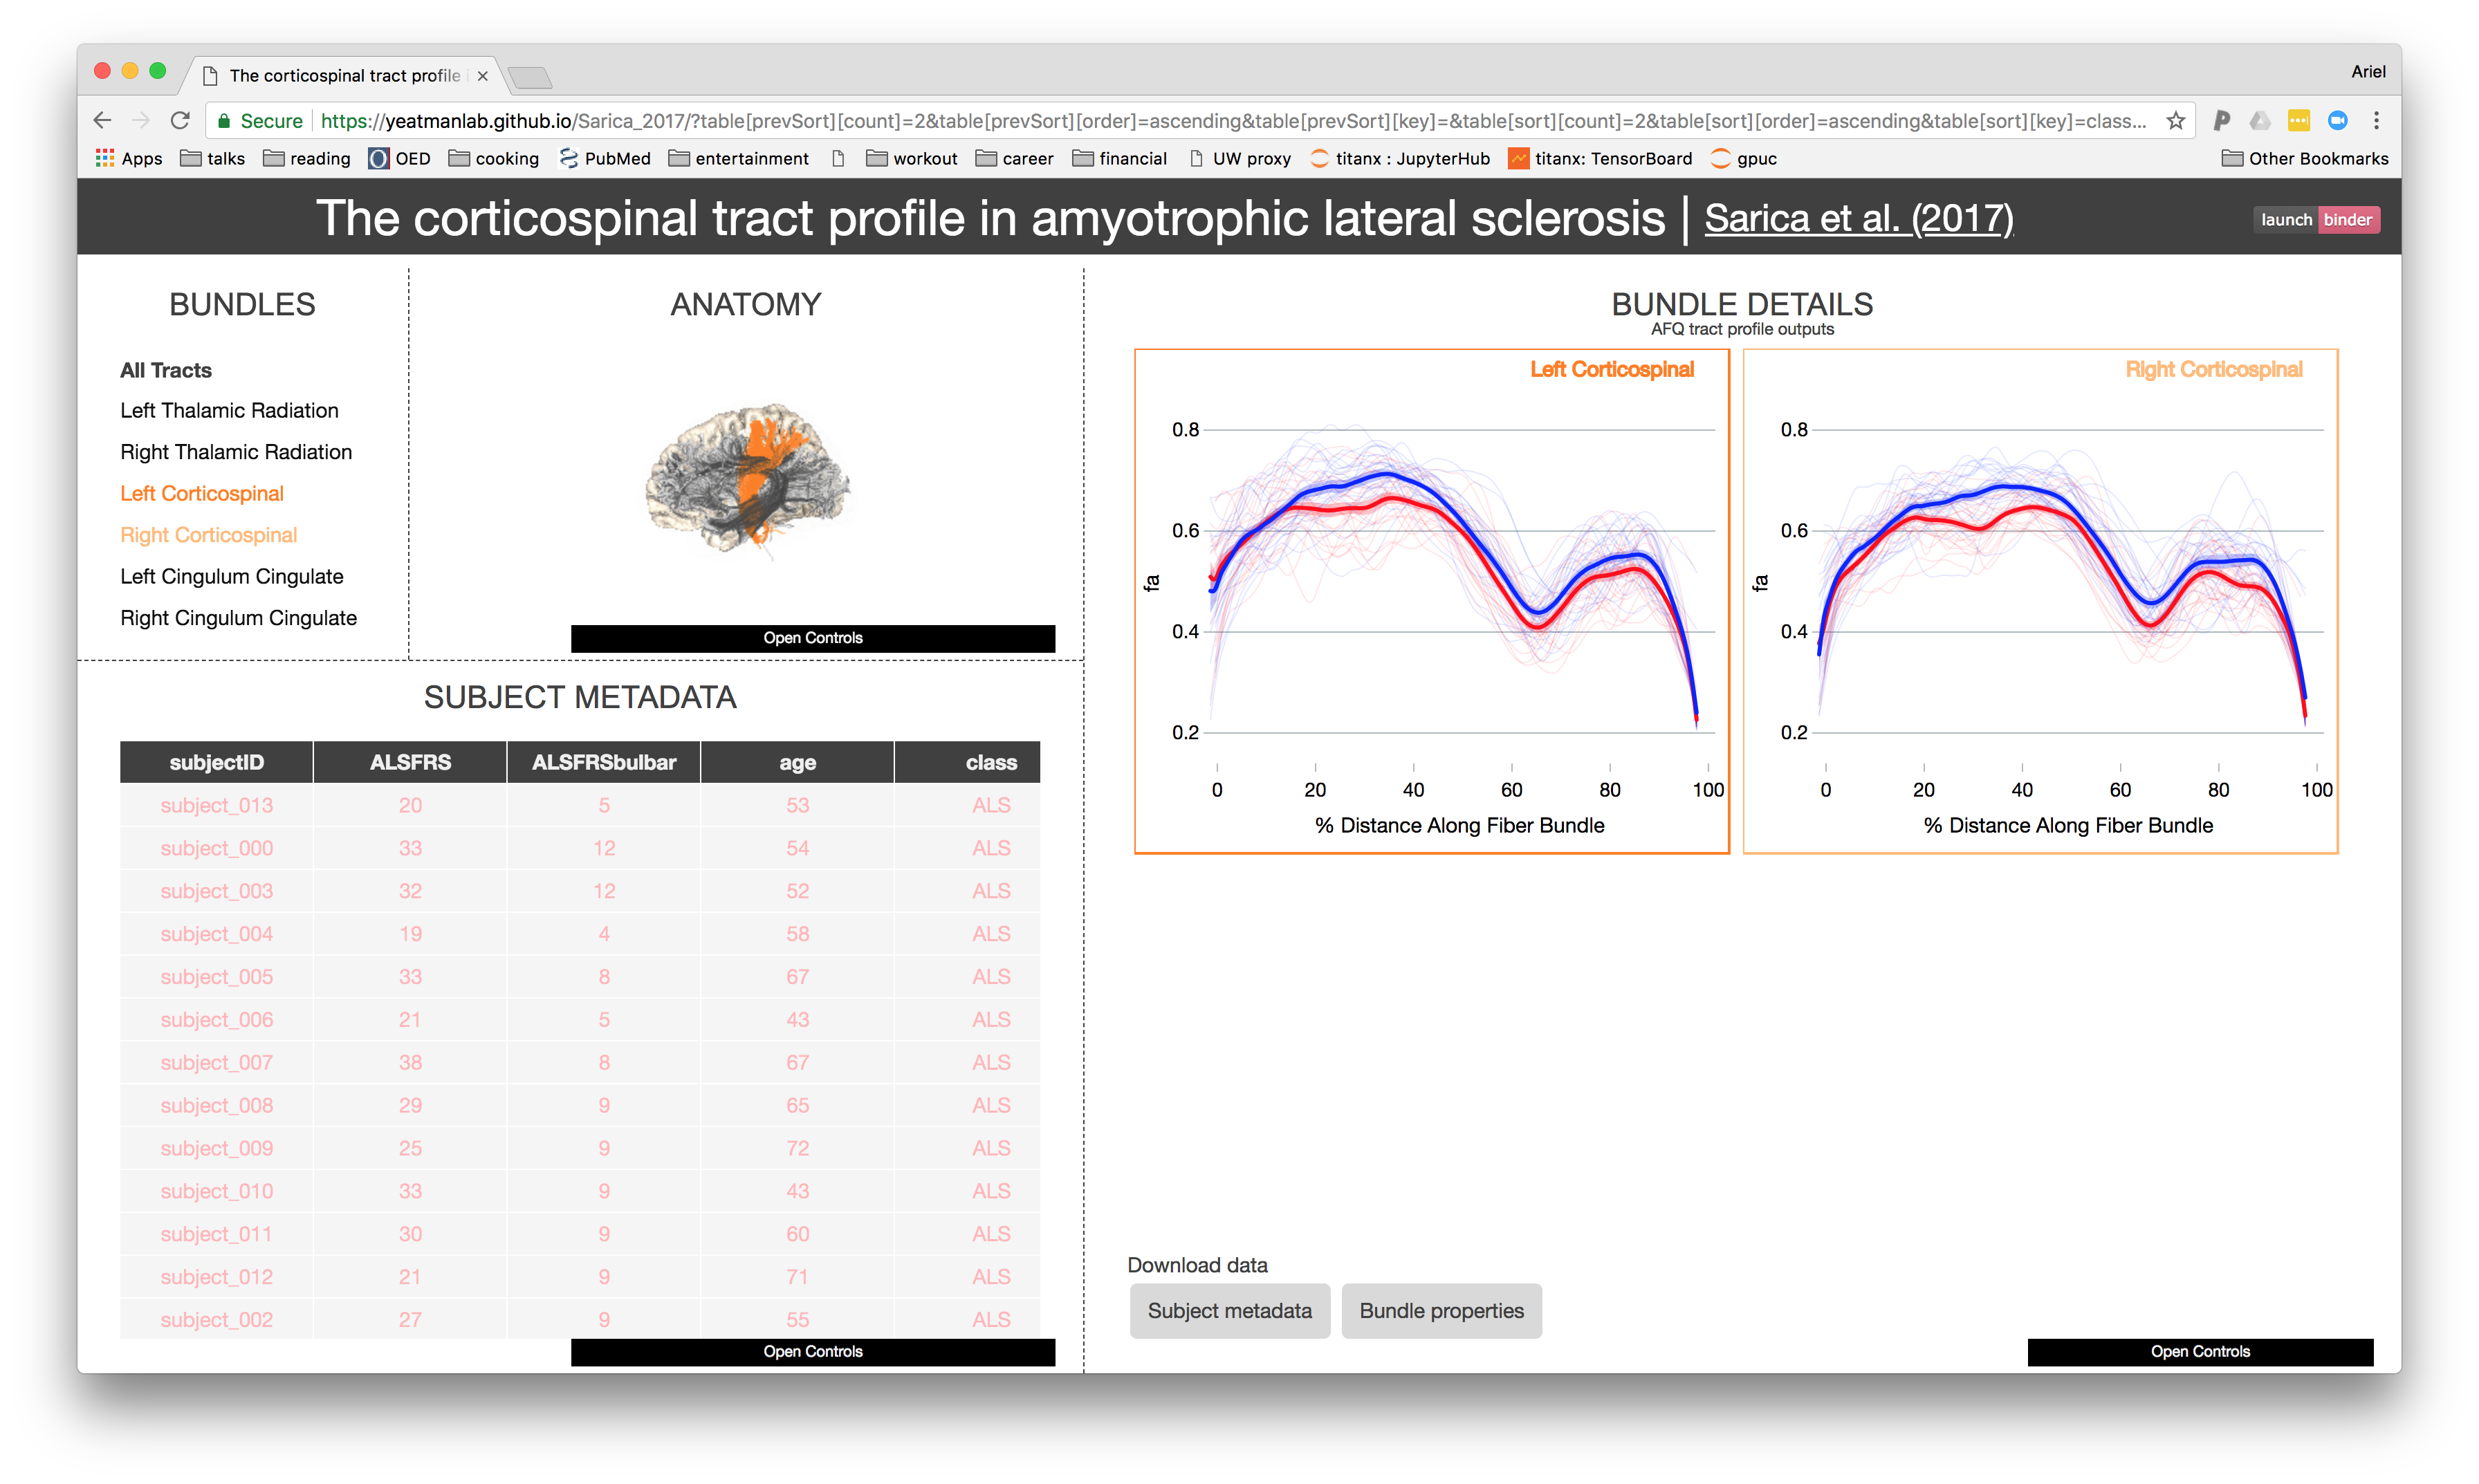
A browser-based tool for visualization and analysis of diffusion MRI data
Jason Yeatman
(UW ILABS)
Adam Richie-Halford
(UW eScience)
Josh Smith
(UW eScience)
Anisha Keshavan
(UW eScience →
Child Mind Institute)
A browser-based tool for visualization and analysis of diffusion MRI data
A web-based application
Leverages modern visualization frameworks
Builds a web-site for a diffusion MRI dataset
Automatically uploads the website to GitHub
https://yeatmanlab.github.io/Sarica_2017
Exploratory data analysis
Enhances published results
Linked visualizations facilitate easy exploration
Enables new discoveries in old datasets
Automatic data sharing
Further exploration
Data sharing facilitates interdisciplinary collaboration
Dimensionality reduced data in tidy table format
Facilitates interdisciplinary collaboration
A data science toolbox to study brain connections
Image processing at scale
Machine learning
Exploration, visualization and data sharing
Challenge: how do we make it reproducible?
How do we make it extensible?
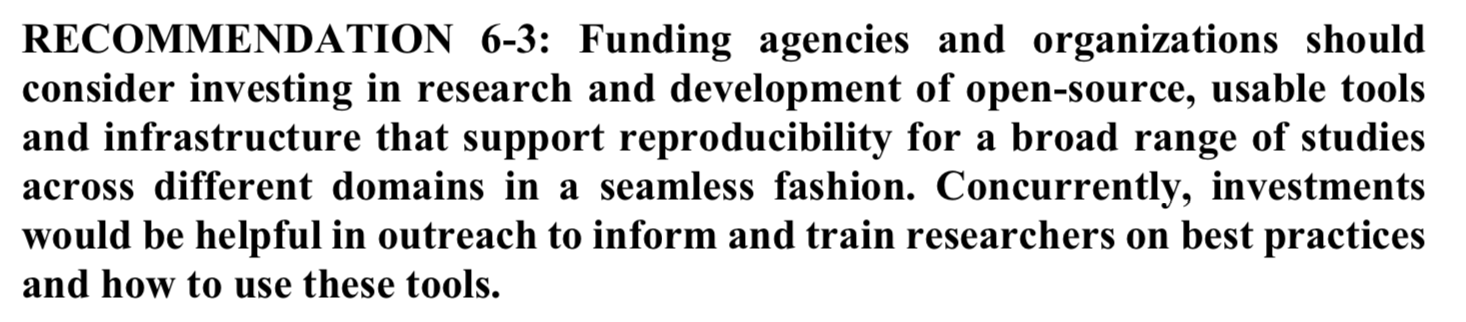
Open source software is a necessary complement to brain observatories
Open-source software and reproducibility
https://github.com/uw-biomedical-ml/irf-segmenter
https://github.com/uw-biomedicasl-ml/oir
https://github.com/uw-biomedical-ml/mri2mri
Braindr + Swipes for Science:
https://github.com/akeshavan/braindr-analysis https://github.com/swipesforscience
Sparse Group Lasso:
https://github.com/richford/AFQ-Insight
AFQ-Browser:
https://github.com/yeatmanlab/pyAFQ
https://github.com/yeatmanlab/AFQ-Browser
Challenge: how do we make it reproducible?
How do we make it extensible?
Open source software is a necessary complement to brain observatories
How do we make it sustainable?
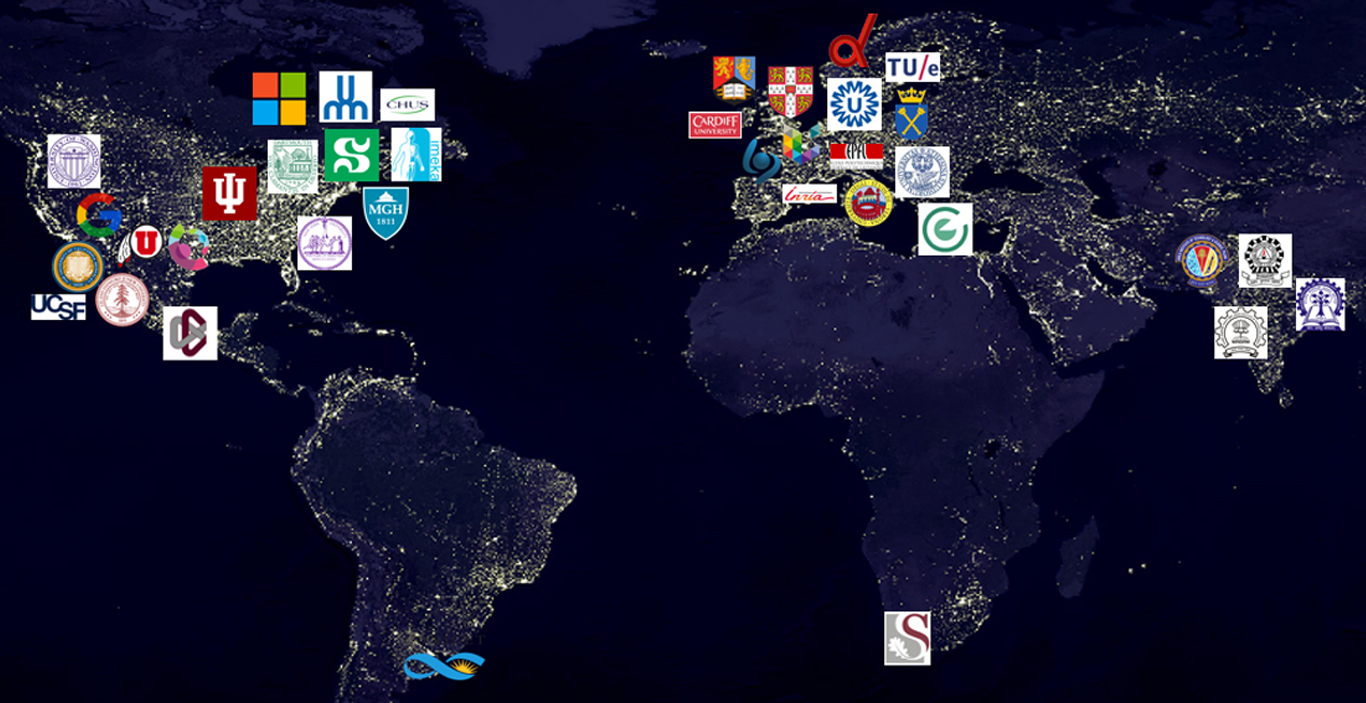
Community-developed open-source software
Open to users
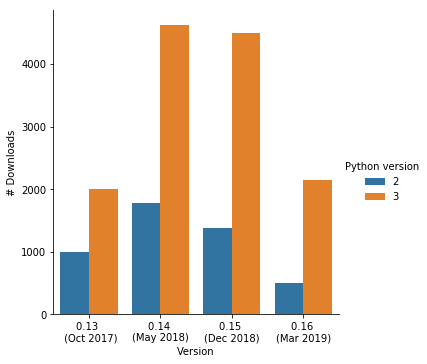
Open to contributors
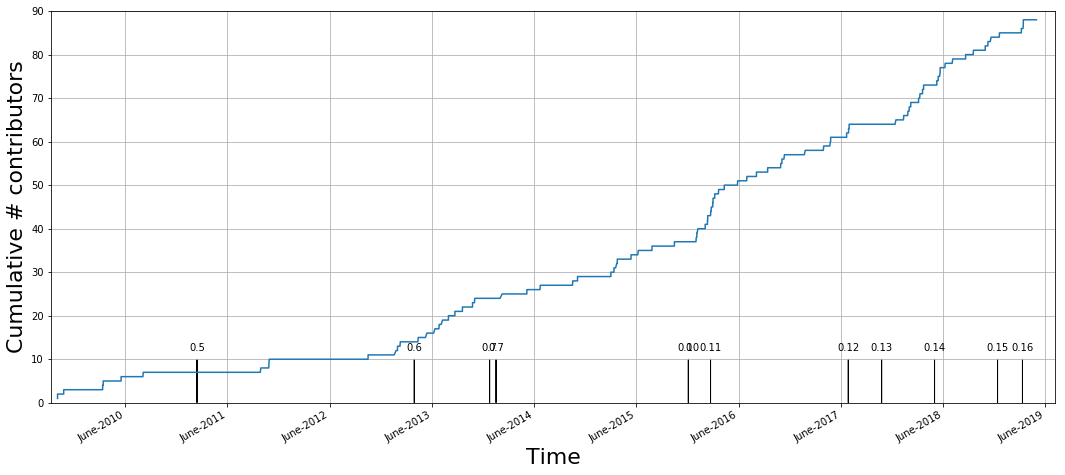
Open to contributors
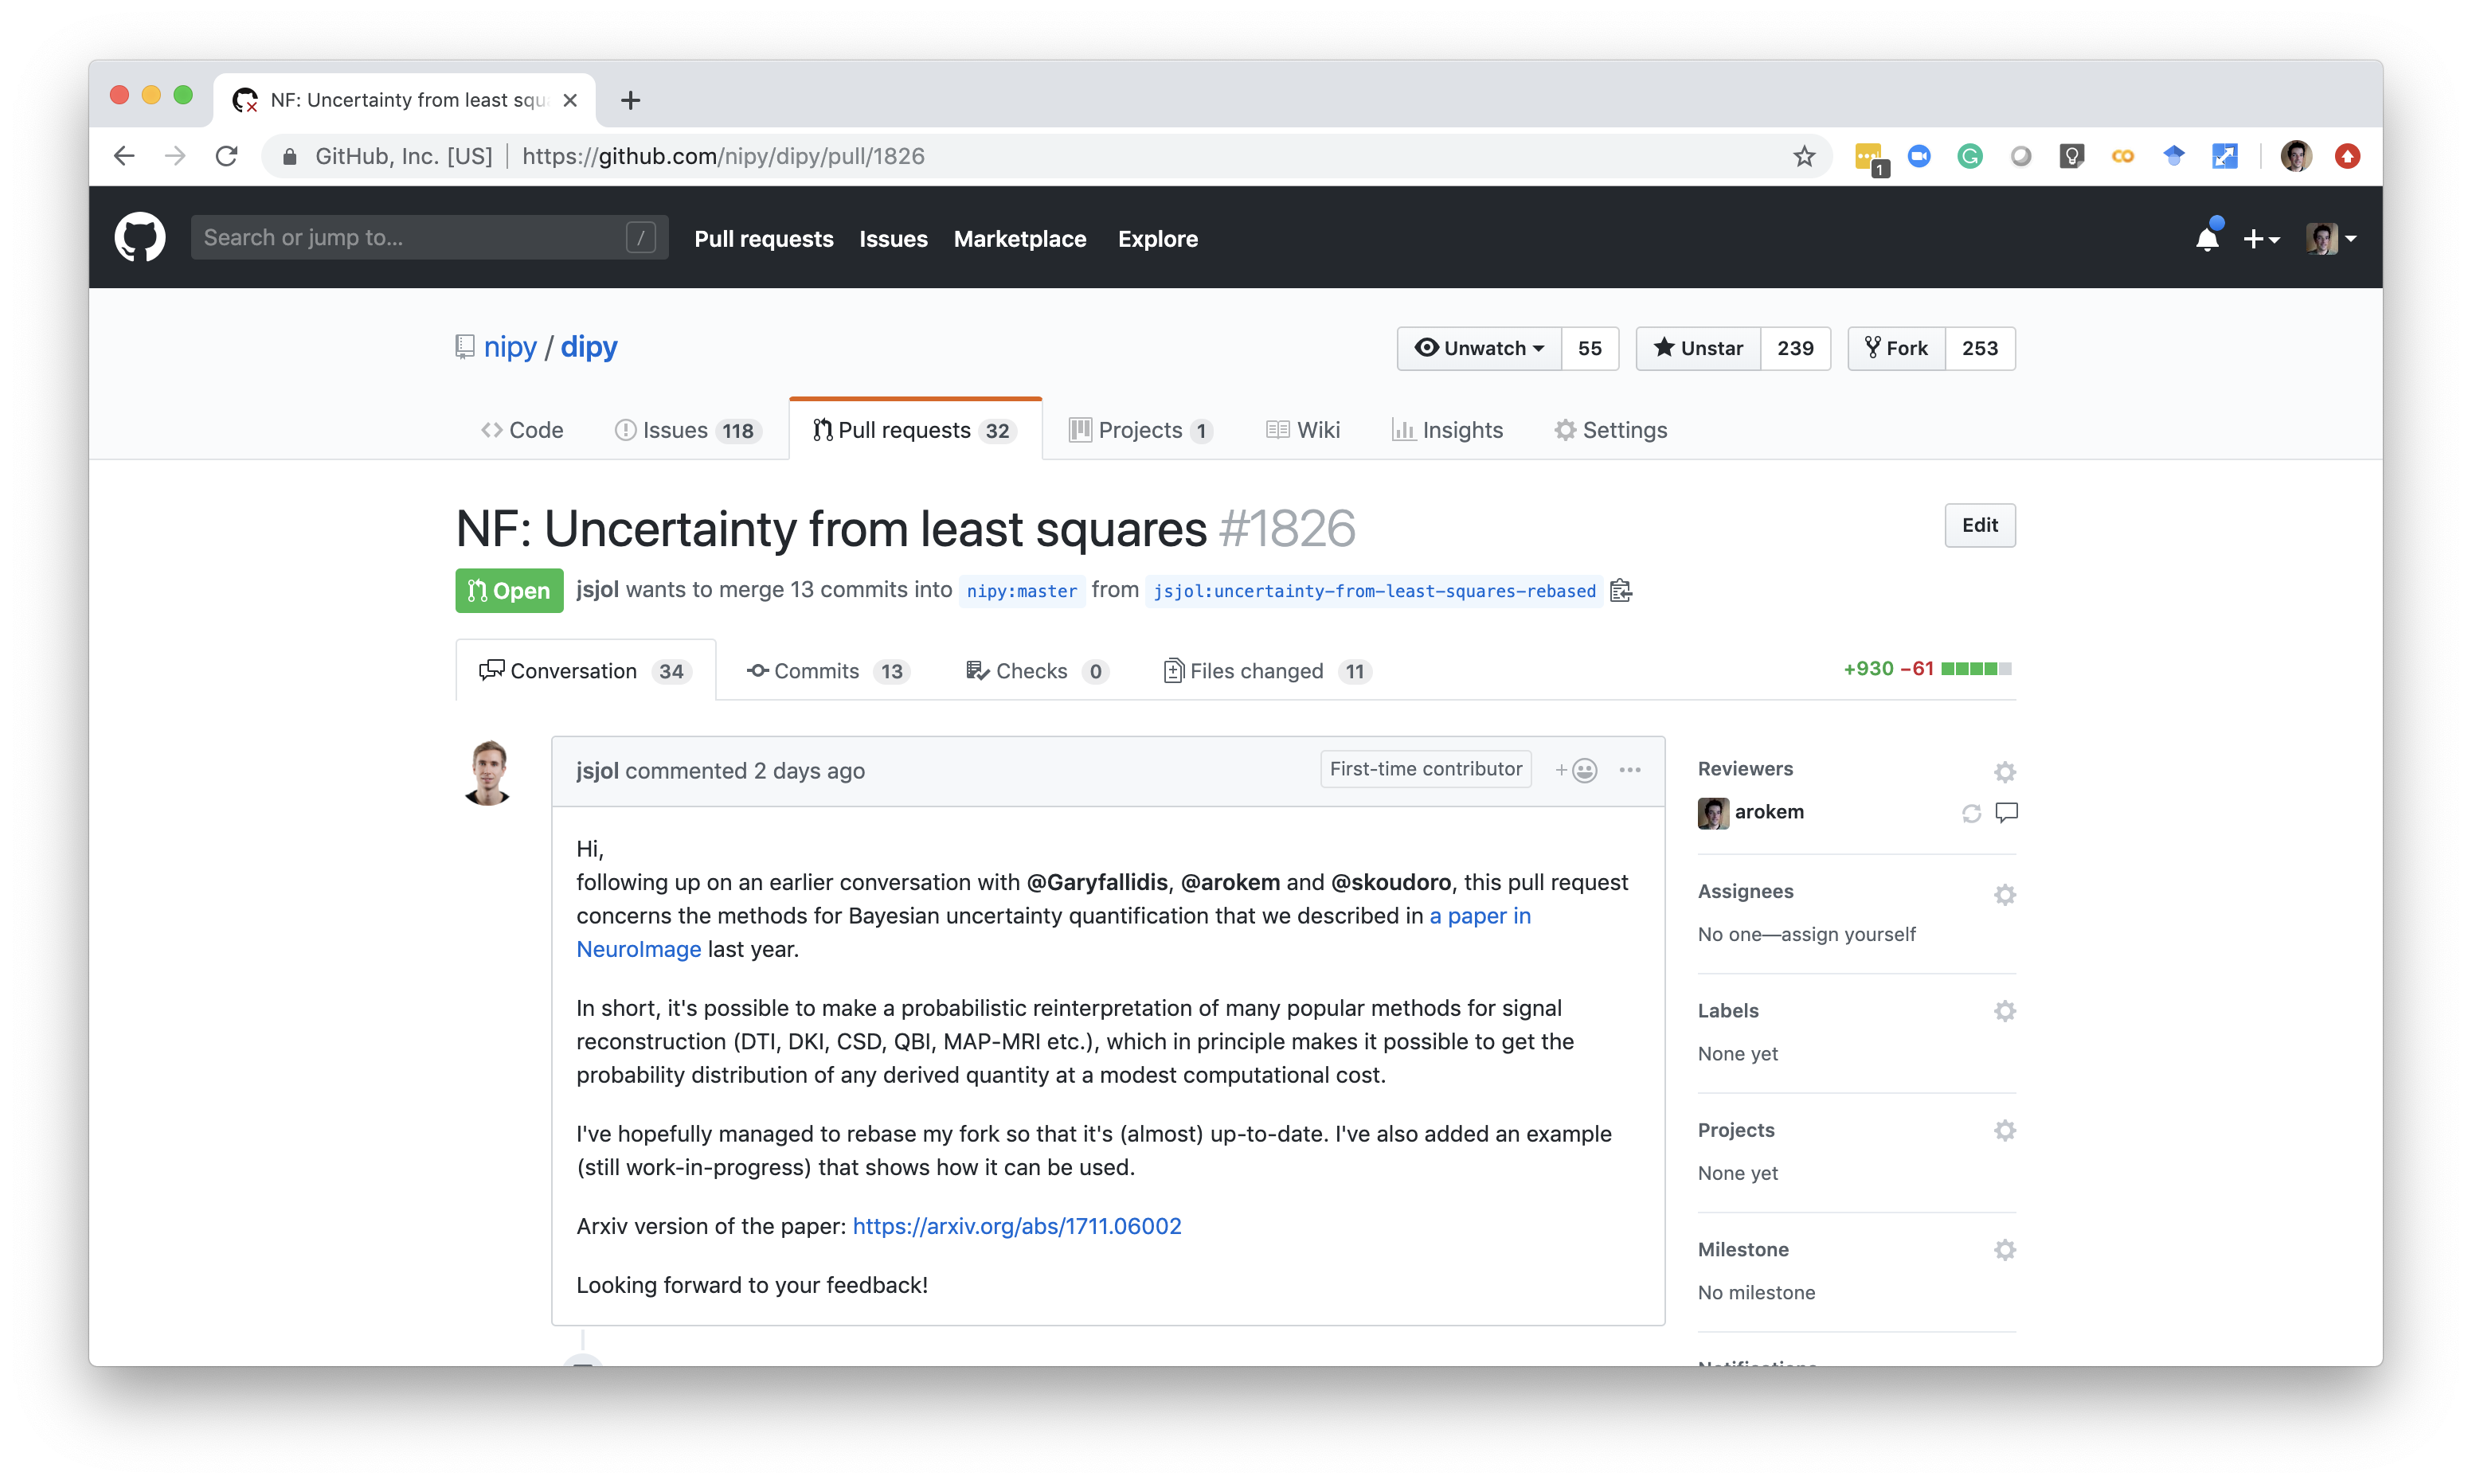
Distributed collaboration
How can we get more people involved?
Methods in data science are rapidly changing
Learning often requires substantial hands-on experience
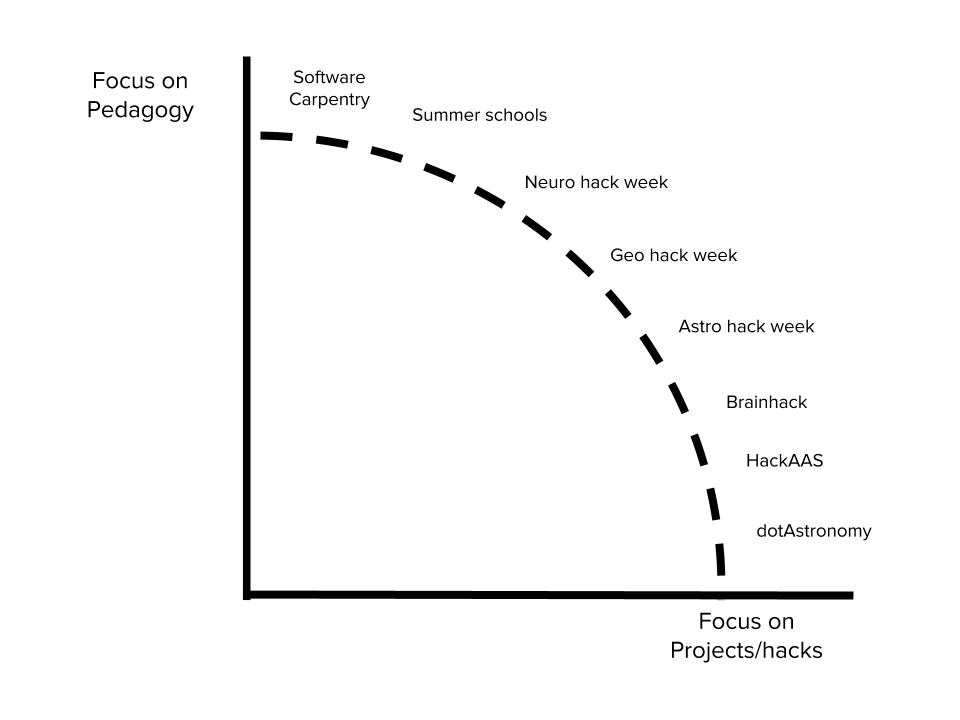
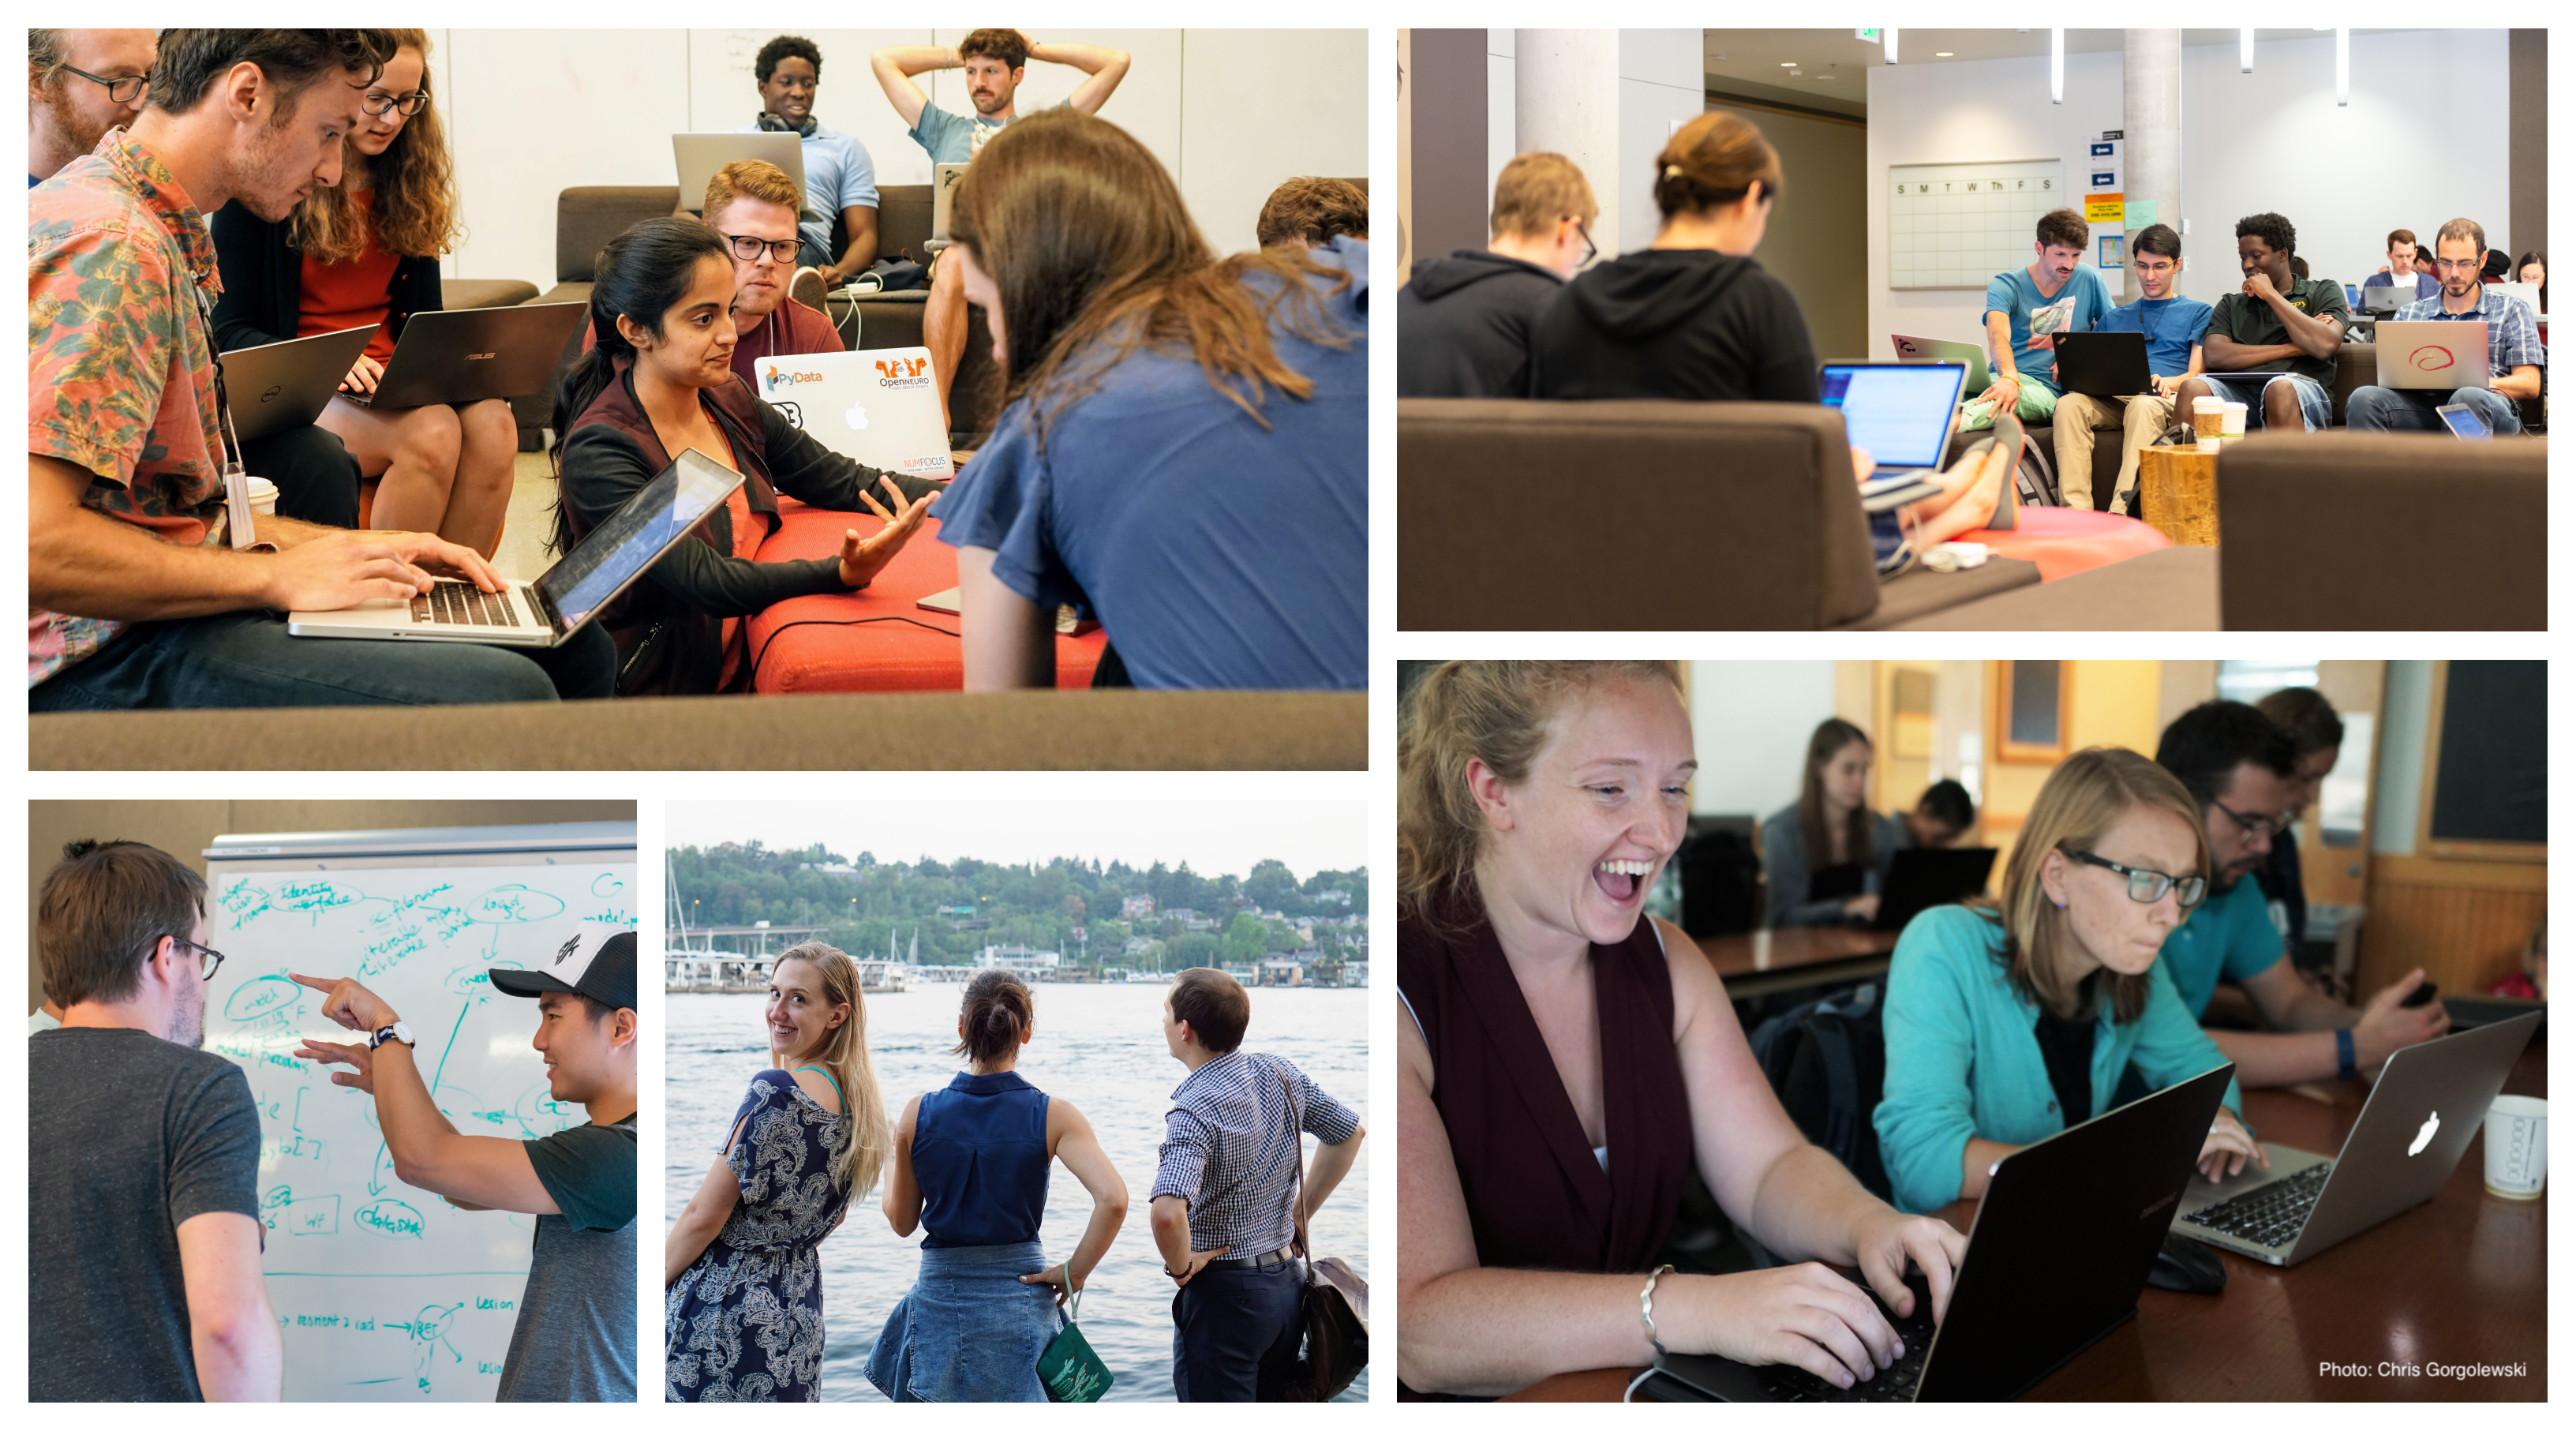
Hack weeks
Week-long events
Combination of learning and project work
A fine balance of pedagogy and hacking
Challenges
Scale
How do we adapt research to big datasets?
Use deep learning and citizen science
Complexity
How do we analyze and interpret multi-dimensional data?
Leverage machine learning techniques that use known brain structure
Socio-technical
How do we collaborate, publish and teach?
Open science: sharing data, software and training
Data science across domains
(Chemical Engineering)
(Ecology)
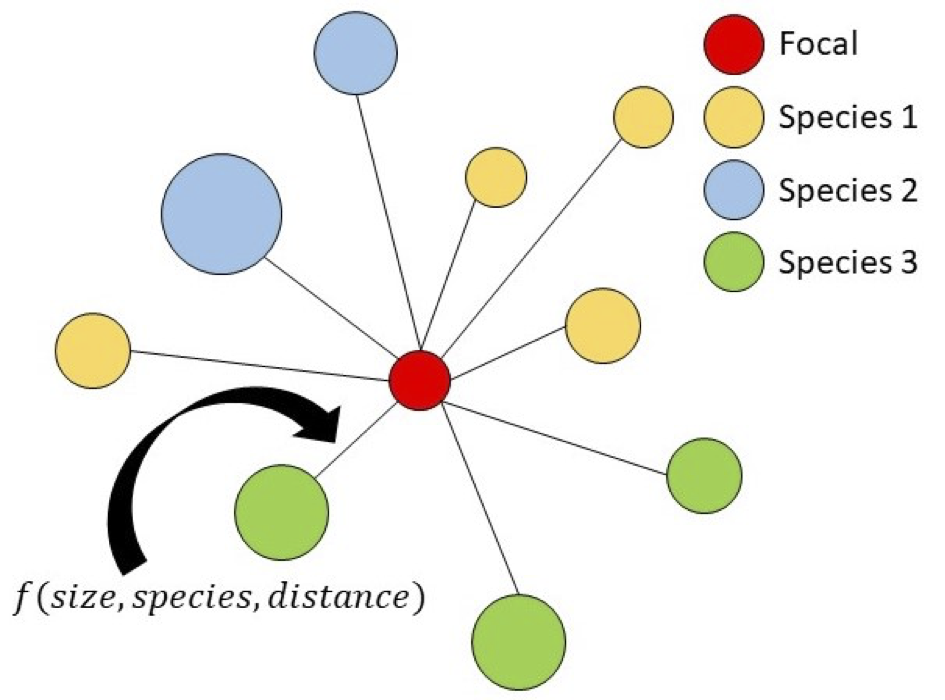 With Stuart Graham, Janneke Hille Ris Lambers
 (UW Biology)
(Data Science for Social Good)
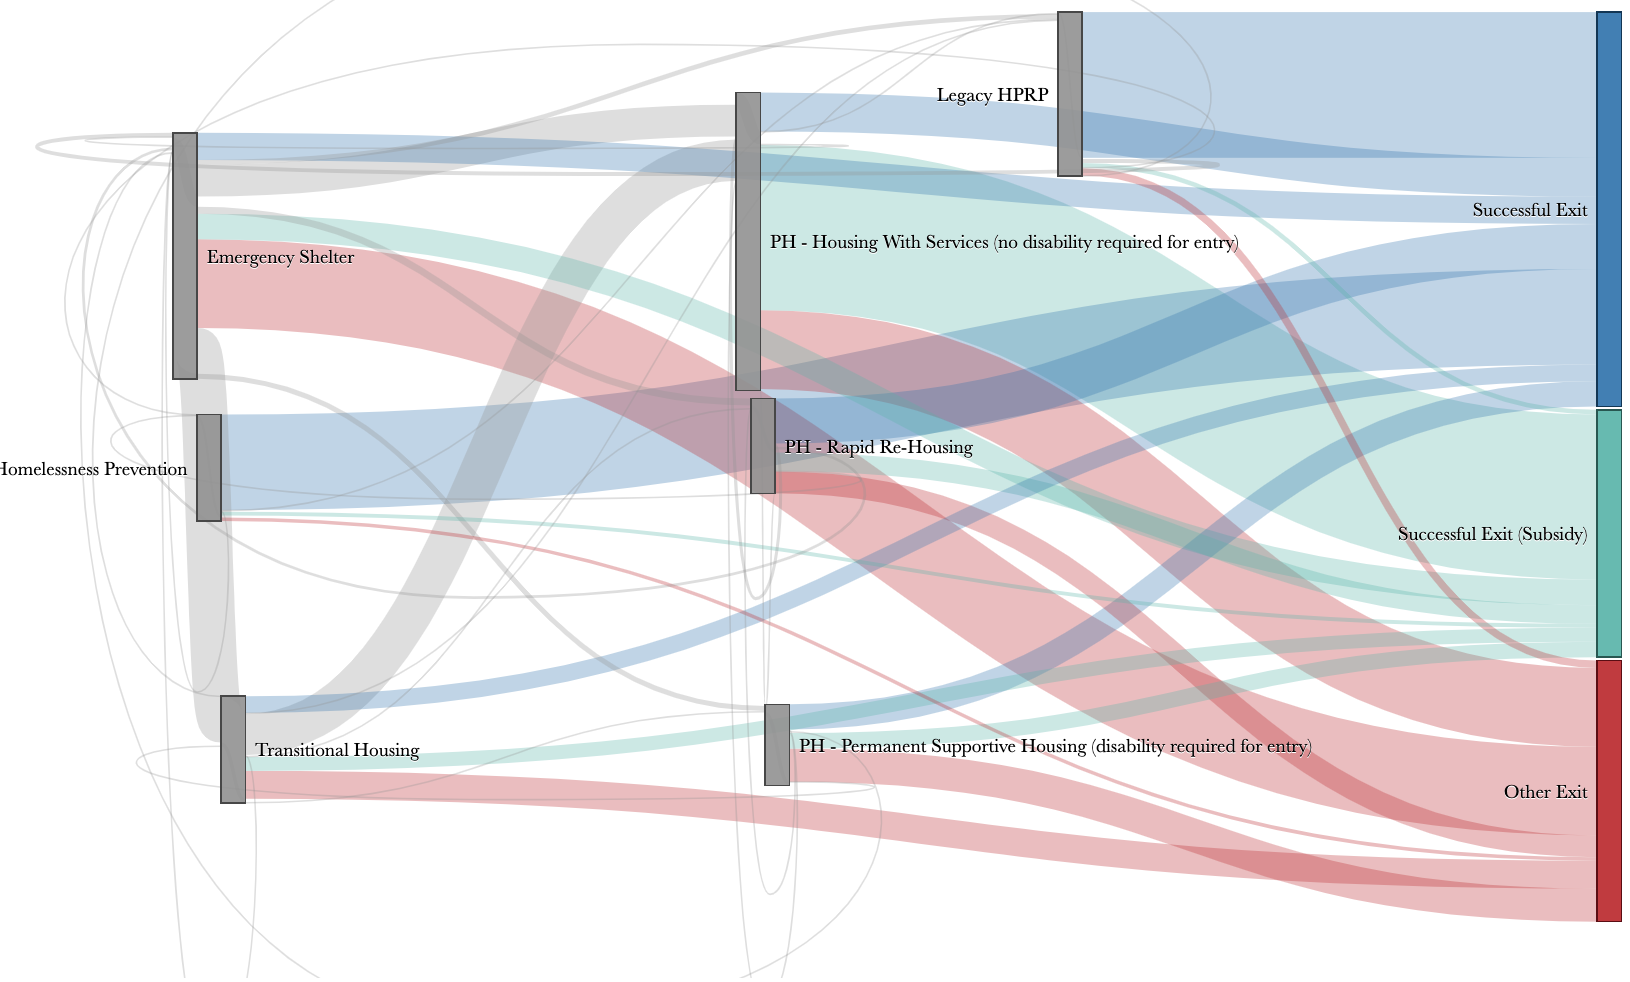 With: SHA, KCHA, KCDCHS, Gates fdn.
Polimis, Hazelton & Rokem (2017)
With: SHA, KCHA, KCDCHS, Gates fdn.
Polimis, Hazelton & Rokem (2017)
Thanks!
Aaron Lee
Anisha Keshavan
Jason Yeatman
Adam Richie-Halford
Josh Smith
Noah Simon
Eleftherios Garyfallidis (IU)
Tal Yarkoni (UT Austin)
Daniela Huppenkothen
Anthony Arendt

Contact information


